Financial Market Analysis
By Shawn R. Carpenter
Tuesday, May 30, 2006
Utilities?

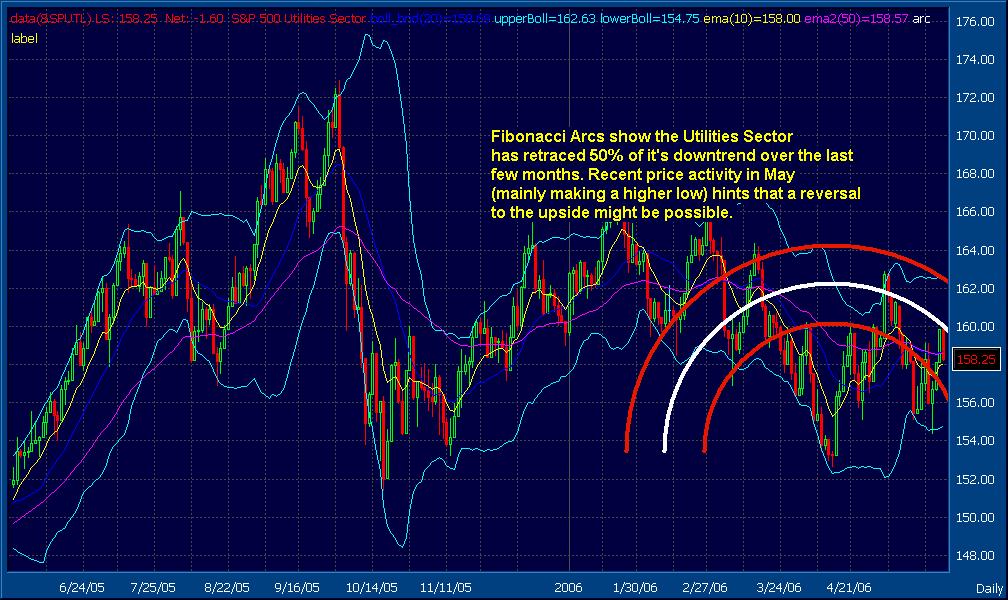
The S&P 500 Utilities Sector might break its current downtrend and head higher. The Fibonacci Arcs in the chart above show that it has recently retraced 50% of its downtrend in recent trading. While this is important, the higher low price pattern in the month of May is of more interest. It suggests that the trading pattern is moving away from a downtrend and might move higher. As the markets make monthly lows, a continuing international spectacle with Iran develops, consumer spending on the decline due to high gas prices, as well as heading into a summer season with increased hurricanes and storms; smart money might be moving some cash into this sector to be put to work. ¶ 5:53:00 PM 0 comments

The S&P 500 Utilities Sector might break its current downtrend and head higher. The Fibonacci Arcs in the chart above show that it has recently retraced 50% of its downtrend in recent trading. While this is important, the higher low price pattern in the month of May is of more interest. It suggests that the trading pattern is moving away from a downtrend and might move higher. As the markets make monthly lows, a continuing international spectacle with Iran develops, consumer spending on the decline due to high gas prices, as well as heading into a summer season with increased hurricanes and storms; smart money might be moving some cash into this sector to be put to work. ¶ 5:53:00 PM 0 comments
Friday, May 26, 2006
Ford Motors...


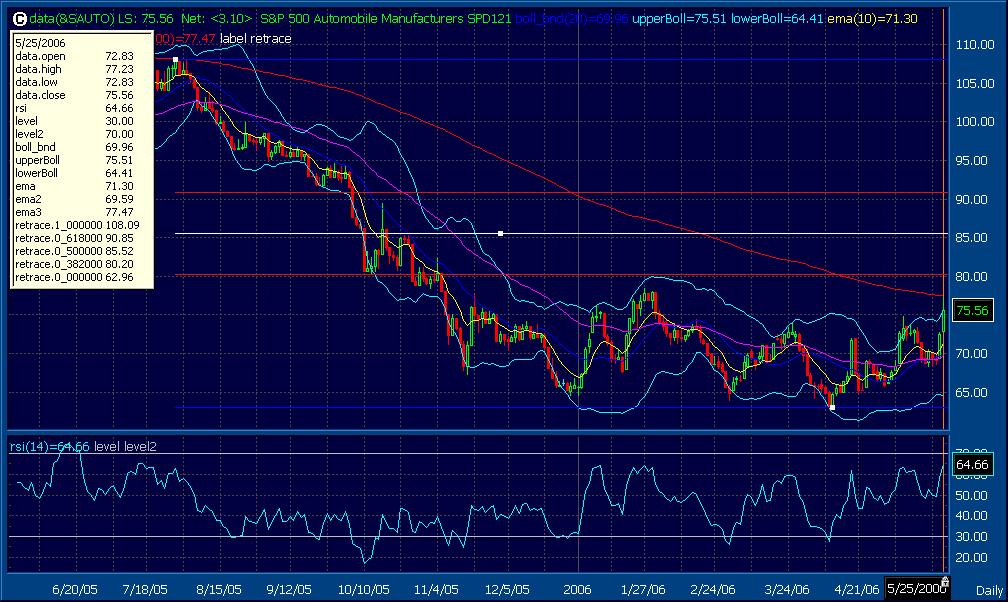
The Auto Sector should see some gains in the days and weeks ahead. Price movement based off of Fibonacci retracements lines of the downtrend suggest the retracements to be 80.20 (38.2%), followed by 85.52 (50%), 90.85 (61.8%), and 108.09 (100%).
Ford Motor company looks like it will be breaking its downtrend with recent price action suggesting that buyers are stepping up to the plate. In the chart above, we see that the yellow circles are points in which the price of Ford broke through the lower Bollinger Band, implying that the downtrend would continue. The green circle points out that the price closed above the lower Bollinger Band and has been confirmed by the May 23rd low. Also, the pinched Bollinger Bands suggest that a major price move is about to happen (either higher or lower). Given the pinched bands as well as confirmation on the low, I would expect Ford to start trading higher. ¶ 8:05:00 AM 0 comments
Wednesday, May 24, 2006
Durable goods decline....

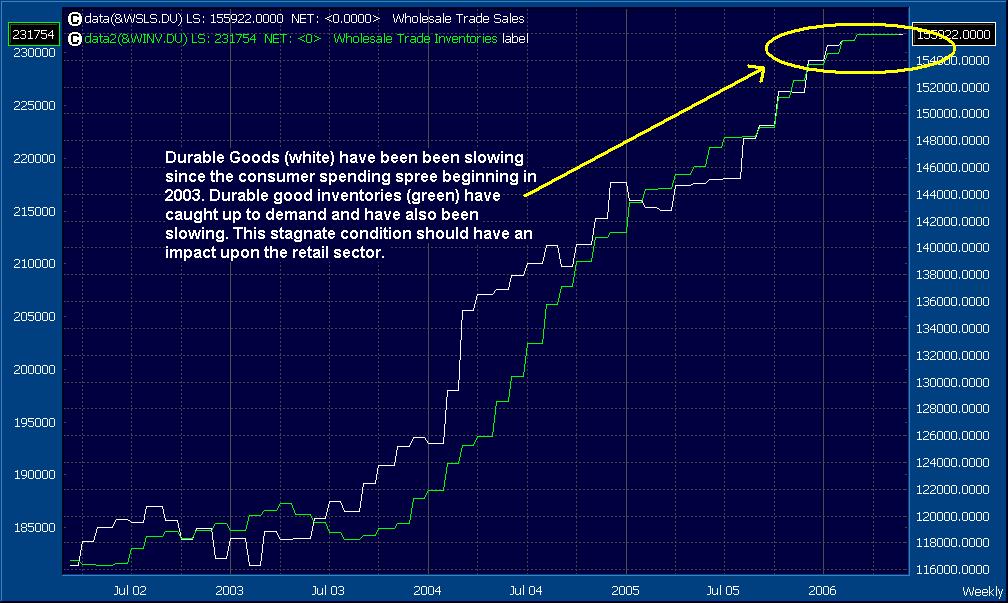
Today's durable good numbers were not good at all. Consumers are not purchasing durable products (such as TV's, freezers, airplanes...things that will last a long time) at a rate that they have been for the last couple of years. One can see that the rate of Durable Good sales has been stagnate, while durable good inventories are catching up to demand.
Seems as if consumers are being more cautious as to what they spend. This could be due to the fact that people are paying more at the pump. As I pulled up to the gas station the other day, I noticed the meter on the pump was $75.00 for the last sale that happened before I pulled up. Who is paying for these prices and tell me how that is not affecting discretionary spending across the board. ¶ 8:43:00 AM 0 comments
Tuesday, May 16, 2006
Retail Home Improvement industry

The S&P 500 Retail Home Improvement chart above suggests names in this group are about to set up for a deep reversal. As you can see, the yellow line represents the home improvement retail sales number. Comparing this to the actual industry, we can see that the retail sales have been not excelling as some would hope it would. The names that comprise the retail home improvement index would be Home Depot (HD), Lowe's Corp. (LOW) and Sherwin Williams (SHW). Watch these stocks begin to decline as more consumers shift away from the housing market and spend their money on other things, such as gas going into the summer driving season!!! ¶ 8:50:00 PM 0 comments

The S&P 500 Retail Home Improvement chart above suggests names in this group are about to set up for a deep reversal. As you can see, the yellow line represents the home improvement retail sales number. Comparing this to the actual industry, we can see that the retail sales have been not excelling as some would hope it would. The names that comprise the retail home improvement index would be Home Depot (HD), Lowe's Corp. (LOW) and Sherwin Williams (SHW). Watch these stocks begin to decline as more consumers shift away from the housing market and spend their money on other things, such as gas going into the summer driving season!!! ¶ 8:50:00 PM 0 comments
Monday, May 15, 2006
Food Distributors..
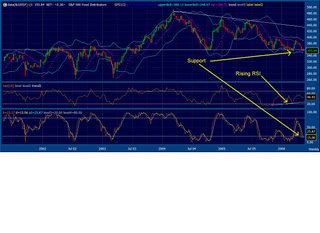
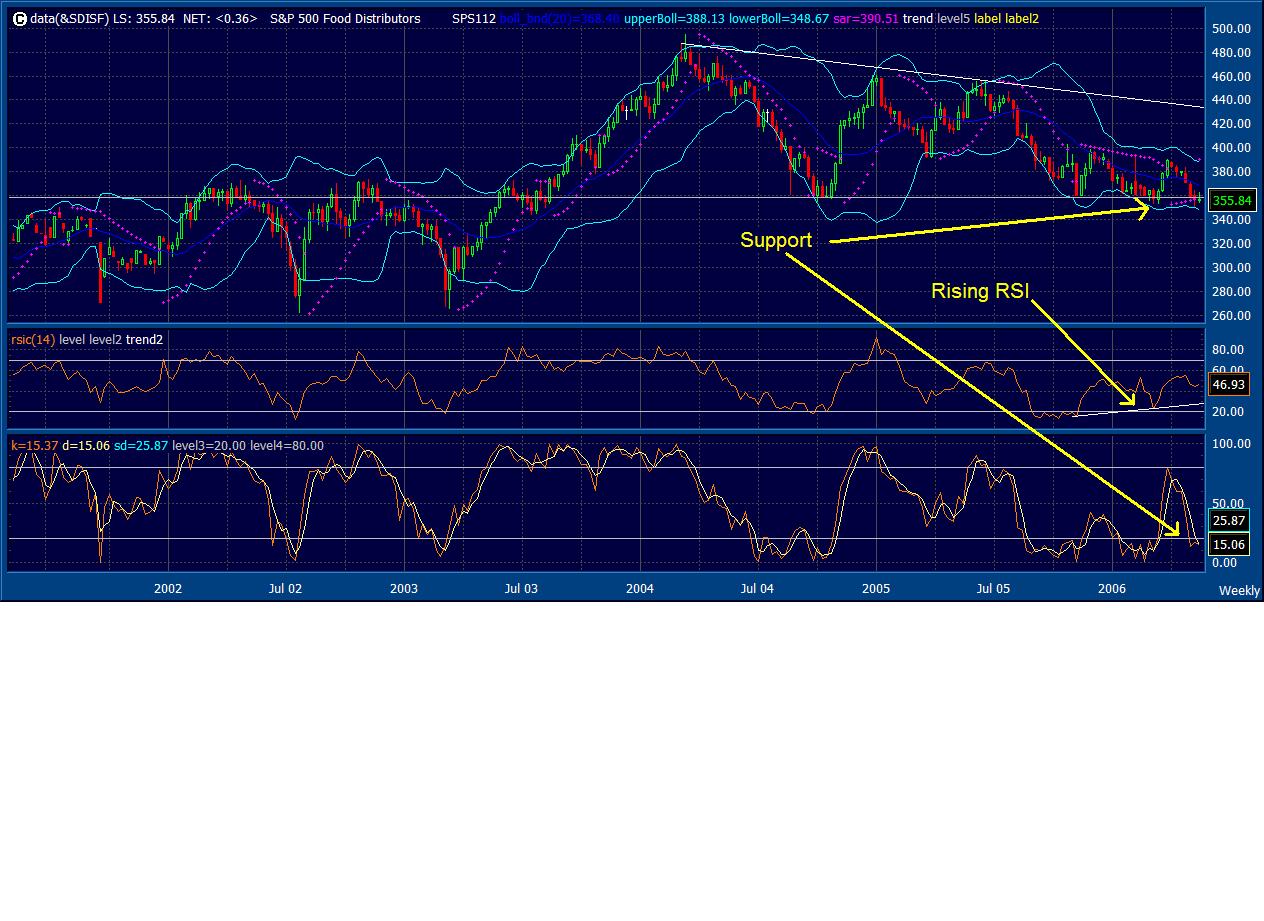
The S&P 500 Food Distributor industry seems to be finding support at these levels. Food, typically a haven for money during uncertain market conditions, should be receiving in-flows of capital as the market heads south. Names to watch and might be of interest include:
SYY - Sysco Corp.
UNFI - United Natural Foods
PFGC - Performance Food Group
NAFC - Nash Finch Co. ¶ 8:47:00 AM 0 comments
Sunday, May 14, 2006
Hedging the downturn...

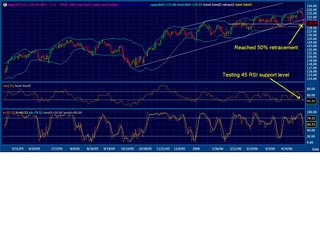
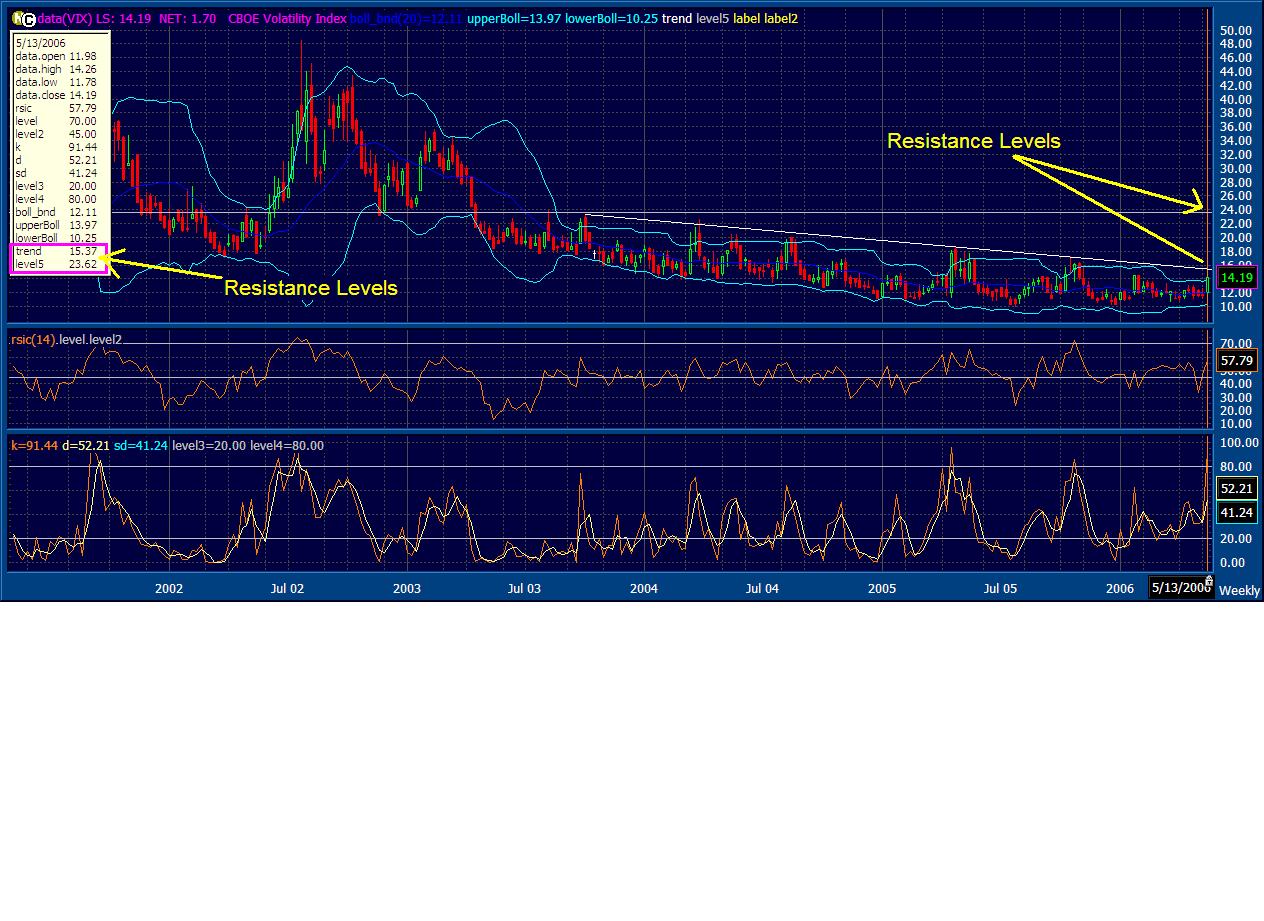
The market is due for a correction since the multi-year rally has run its course. While this has began to surface as the market slid last week, we will see more selling as the weeks continue. A look above shows that the VIX index has just turned the key and will be firing all cylinders as the market goes down. Weekly, medium-term resistance levels are 15.37 and 23.62.
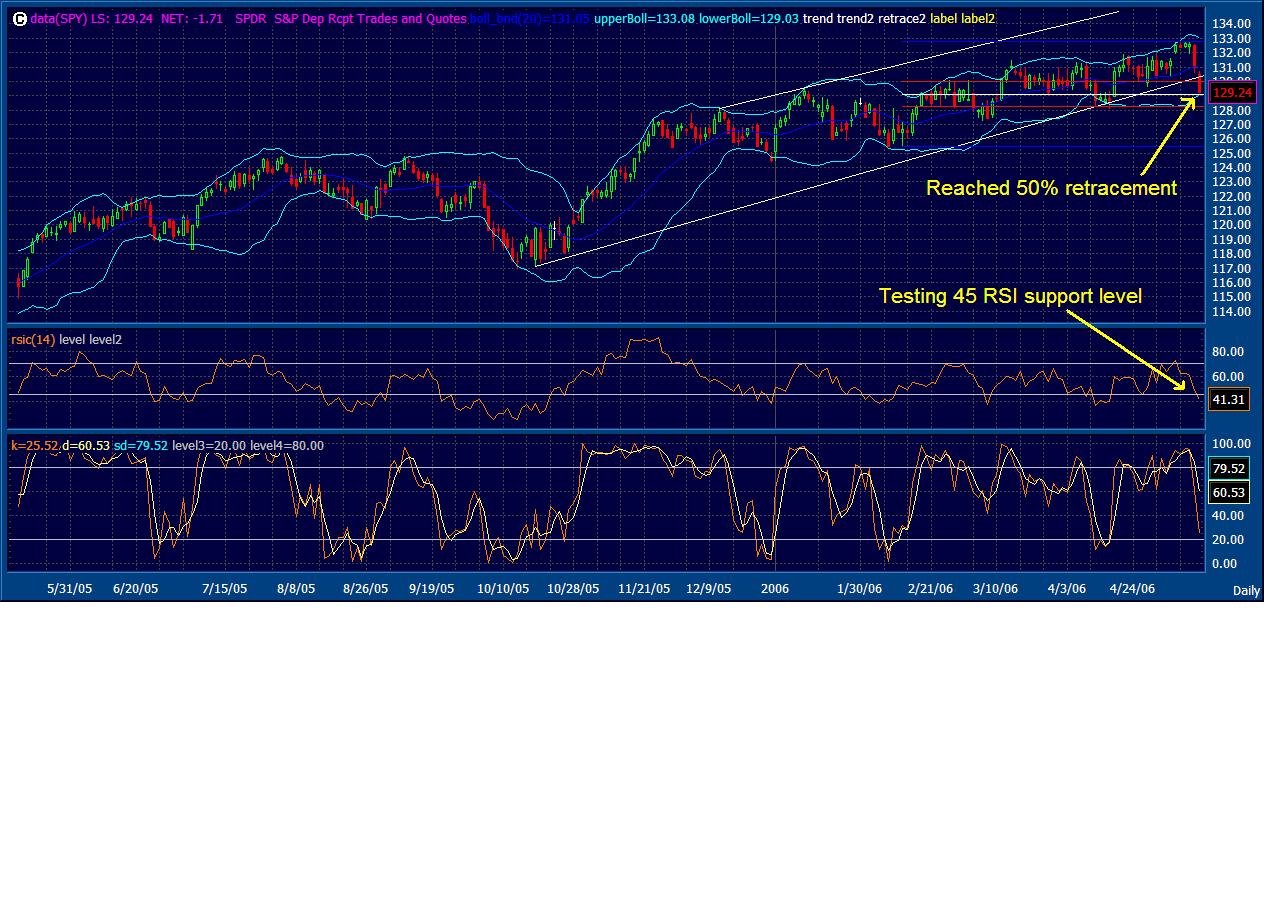
The SPY is looking at a major test this coming week. If we hold the 129.12, we might see a rebound. This is supported by the RSI reaching the adjusted lower level @ 45. Yet, considering the VIX chart and current market sentiment, we will probably see prices break down past these support levels. ¶ 7:45:00 PM 0 comments
The market is due for a correction since the multi-year rally has run its course. While this has began to surface as the market slid last week, we will see more selling as the weeks continue. A look above shows that the VIX index has just turned the key and will be firing all cylinders as the market goes down. Weekly, medium-term resistance levels are 15.37 and 23.62.
The SPY is looking at a major test this coming week. If we hold the 129.12, we might see a rebound. This is supported by the RSI reaching the adjusted lower level @ 45. Yet, considering the VIX chart and current market sentiment, we will probably see prices break down past these support levels. ¶ 7:45:00 PM 0 comments
Tuesday, May 09, 2006
Chemical Sector is rising...

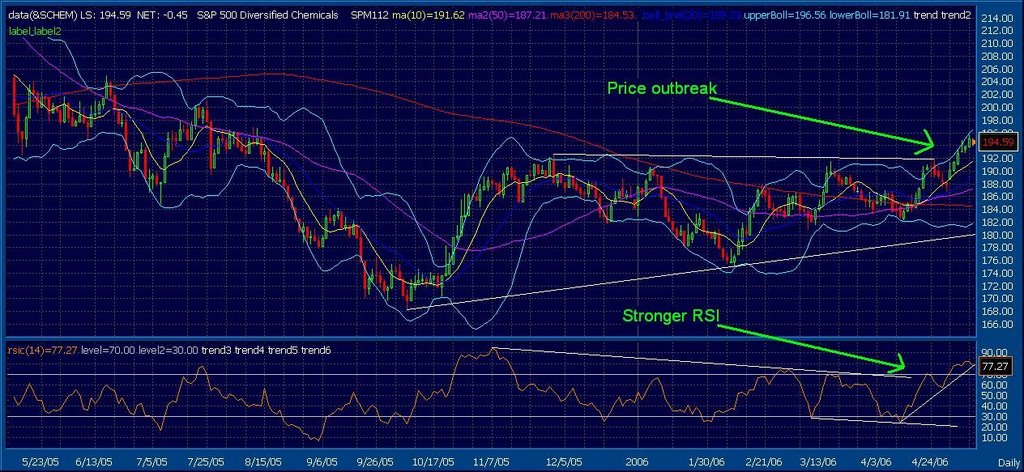
The S&P 500 Chemical Sector has brokern through resistance levels as of lately and is headed to new levels. As we can see from the chart above, the industry has broken out of its consolidation and is headed higher. Some names to look out for would be:
DD - DuPont El de Nemours
DOW - Dow Chemical Co.
PPG - PPG Industries Inc.
Ash - Ashland Inc.
EMN - Eastman Chemical Co.
EC - Englehard Corp.
HPC - Hercules Inc.
Also, we have seen a significant rise in commodities (see my forecast on the price of gold from past posts) which can affect the Feds judgement on inflation in their next meeting. While there has been some research pointing that the amount of money spent on natrual resources has decreased gradually per household, I still believe that this current spate of oil price upon the consumer will tend to spill over into consumer spending going forward. ¶ 1:20:00 PM 0 comments
Wednesday, May 03, 2006
The VIX points to market decline...
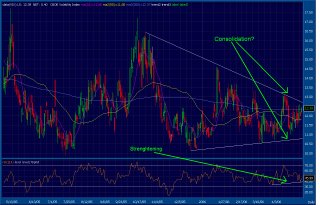
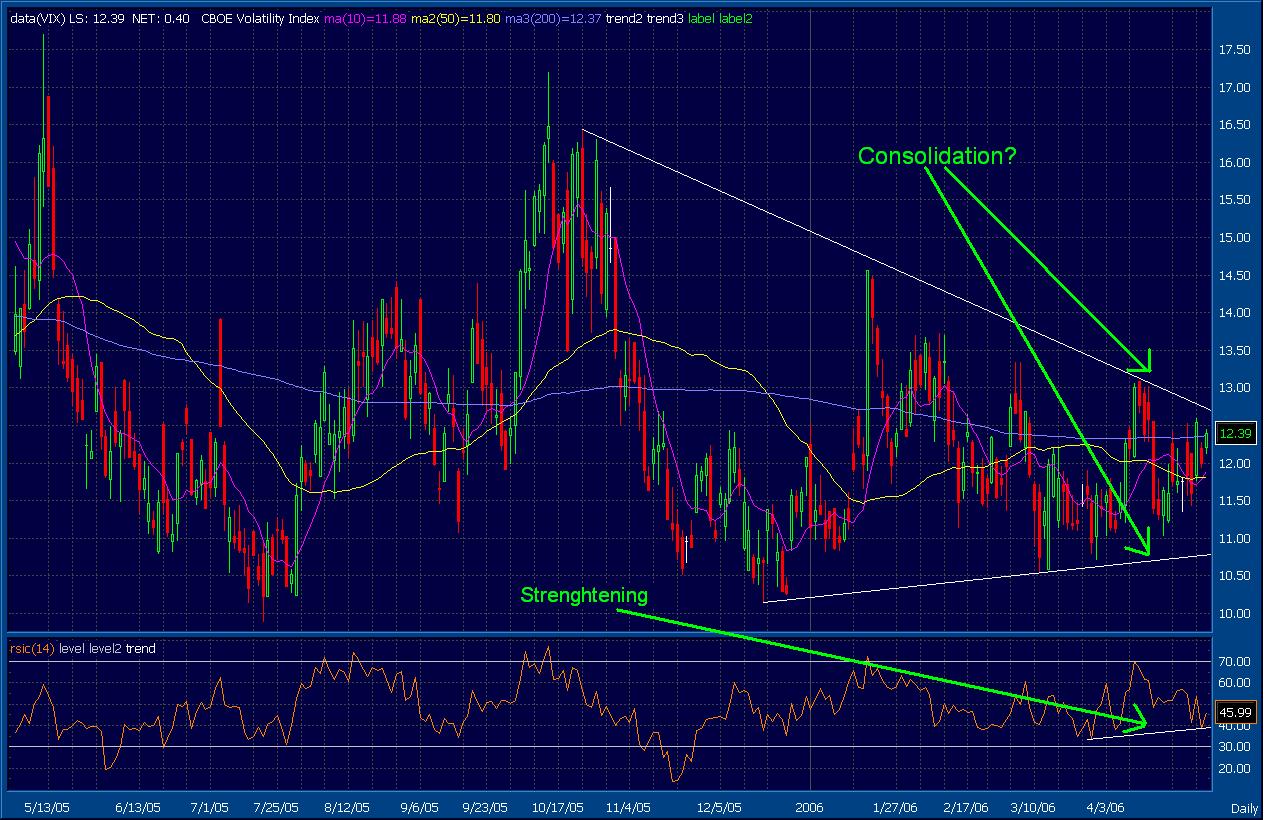
The VIX, a common index used to gauge how much volatility or risk there is in the market, seems to be implying an upward move. After downtrending since the multi-year long rally, there seems to be suggestions that the index is in a consolidation phase. The VIX is read as being on the opposite side of the market, such as a inverse reactor to the actual market. This means that as the VIX slides, investors are at ease with the current market conditions. As the market becomes weak or retraces, the VIX moves higher. At this point in time, we can say that the market is gearing up for a reversal.
In the above chart, we can see the wedge pattern that is forming on the VIX. Volatility in the total markets put vs call ratio suggests that investors are feeling worried. Maybe the Iran situation, price of gas at the pump, or an end to the multi-year rally is causing smart money to place bets against a move higher. ¶ 2:17:00 PM 0 comments
![[Most Recent Quotes from www.kitco.com]](http://kitconet.com/charts/metals/gold/t24_au_en_usoz_2.gif)
![[Most Recent Exchange Rate from www.kitco.com]](http://www.weblinks247.com/exrate/24hr-euro-small.gif)