Financial Market Analysis
By Shawn R. Carpenter
Tuesday, August 29, 2006
Home Depot...

Home Depot is looking really good right here. Price action has test support levels and it might bounce from here. Home Depot might find some legs given Hurricane Ernesto is approaching Florida as well as insurance checks being paid to New Orleans residents to rebuild. It will be interesting to see if the Home Depot can receive business of off these two issues. I currently feel that a Fibonacci retracement could lend future prices towards the $38.00 level. ¶ 2:50:00 PM 0 comments


Home Depot is looking really good right here. Price action has test support levels and it might bounce from here. Home Depot might find some legs given Hurricane Ernesto is approaching Florida as well as insurance checks being paid to New Orleans residents to rebuild. It will be interesting to see if the Home Depot can receive business of off these two issues. I currently feel that a Fibonacci retracement could lend future prices towards the $38.00 level. ¶ 2:50:00 PM 0 comments
Wednesday, August 16, 2006
The Spiders....
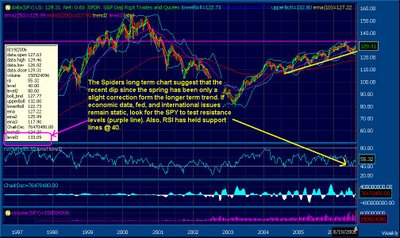
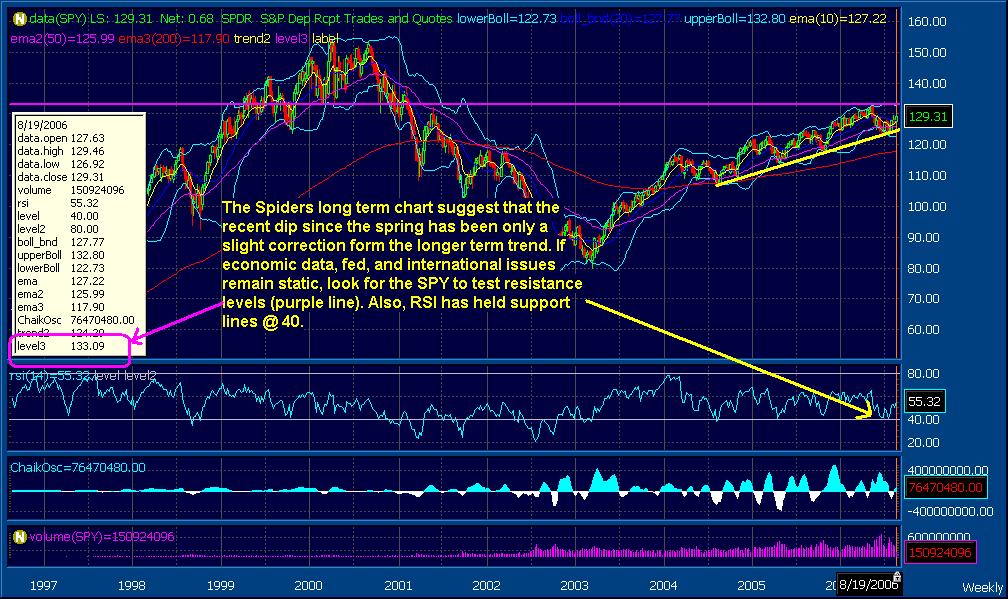
The S&P 500 ETF is looking very nice!
While the whole market has dipped since last spring due to numerous factors, the current state of the Spider ETF is looking well. In the chart above, you will see the 10 year weekly chart of the contract. You will notice the yellow support line of the multi-year rally that has taken place from 2003 to the present. This recent correction in the markets still lands within the support lines of the longer term rally. This correction also fell to the support level of 40 on the RSI, a bullish signal. While this may be true, we must take into account that in order for this rally to be sustained, it must break through the resistance level (purple line- 133.09). This resistance level is a key level in that the previous bull rally will end and a new bear rally will ensue if this level is not broken. Levels at 132.09, 132.80, 133.09, should also be watched with interest.
Given that there are multiple concerns which could still affect the overall market, we should be looking at this resistance level over the next few weeks. Concerns about hurricane season, nuclear issues with Iran and North Korea, as well as the Middle East War with Israel and Hezbollah will still play an active role should any one of these issue flare. ¶ 11:10:00 AM 0 comments
Tuesday, August 08, 2006
Resistance levels of Natural Gas

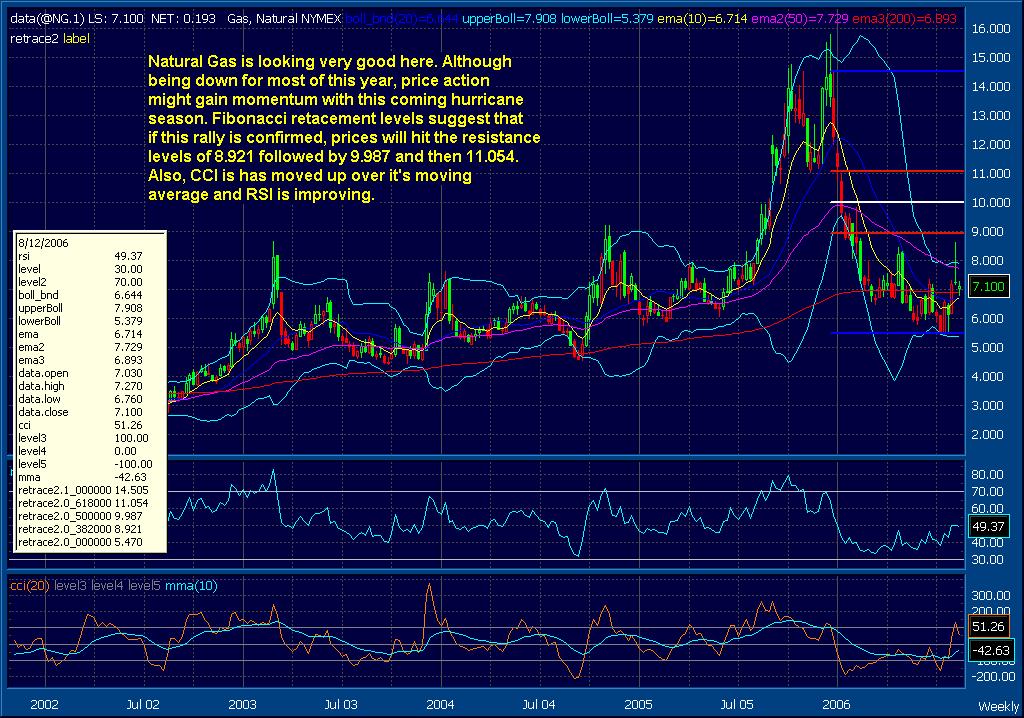
Natural Gas has been in a major downtrend since last year's bull rally. We can see that prices have topped out around $15.00 last year and then headed lower, consolidating around the $6-$7 level. Going forward, if a rally becomes evident, we can expect prices to rise to higher levels. Based on Fibonacci retracement levels, 8.921 (38.2%), 9.987 (50%), and 11.054 (61.8%) would be the resistance levels at which sales should occur. To back up a rally, we could see the CCI has broken through it's moving average (bullish), and RSI seems to be gaining a little ground.
Why would this market break out? As we just entered hurricane season which expects to bring a few storms that could do damage, the main emphasis would be another storm hitting the Gulf coast. This region is a hotbed for the natural gas market, pipelines, and refineries. As Hurricane Katrina damaged the reason, we saw prices of Natural Gas explode to the $15.00 level. Another one could have the same effect.
Also, keep any eye out on the inventory number which is due out this Thursday (tomorrow). The heat waves from the last couple of weeks should have an impact on the draw down from inventories. This would lead to price spikes and should rally the market. However, beware the fact that recent weather predictions for the nation have been modest for the next couple of weeks. This could give ample time to resupply the lost inventory, thus leading to lower than expected rally prices. ¶ 5:46:00 PM 0 comments
Wednesday, August 02, 2006
Light Sweet Crude.....

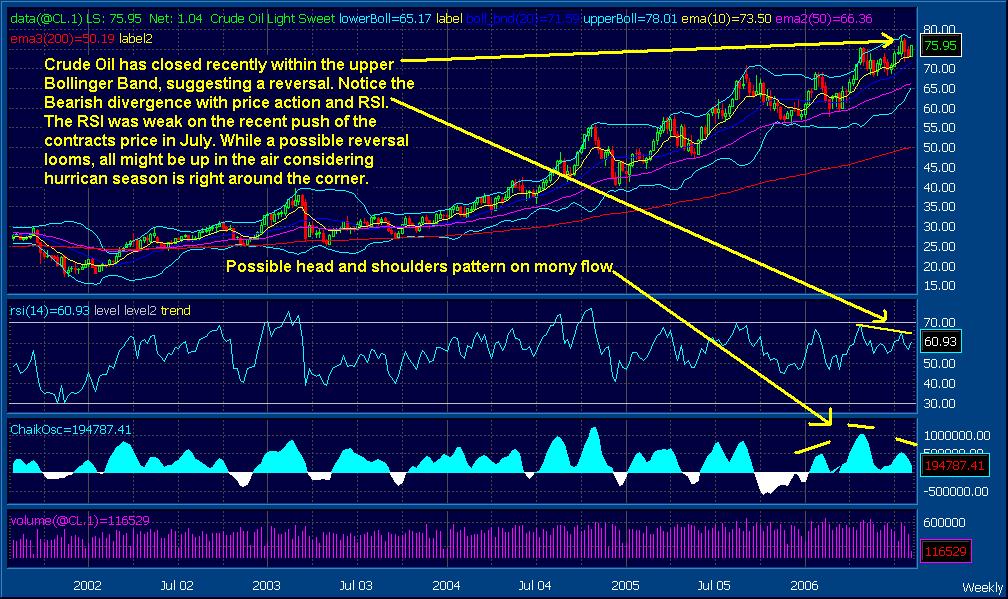
Is the recent rally for Light Sweet Crude about to come to an end? While chart above might present a well defined bull run, recent price activity might suggest the short term of oil might be due for a pullback. Upon further study, you will notice that in the weeks of July 15 and July 22, the price of the oil closed within the Bollinger Bands. Common interpretation of this pattern suggests that prices at this level might be pricey.
Digging deeper, we see that the RSI oscillator is suggesting a bearish divergence from the July highs. This suggests that the strength of the July move has been weak. This classic pattern suggests that prices might be due for a break, possible weakness in the near term.
Finally, the Chaikin Oscillator is suggesting that the July spike might be overdone and furthermore, the bull rally might need a pullback. This oscillator identifies the relationship of the average price of the underlying asset with respect to the volume present at that time. In other words, it shows how much money is being put to work in a particular asset at a given price. A high Chaikin Oscillator suggest money is flowing into the asset. In this case, we again see the bearish divergence of the Chaikin Oscillator and the price of oil. The Head and Shoulders pattern might suggest that a pause, or pullback might be imminent.
While these technical aspects are very revealing, there are some cautions to be aware of. We are at the critical juncture of hurricane Season. With expectations of a strong season, it would be prudent to see that these technical indicators can be disproved with a hurricane that can disrupt areas of the economy. Also, Middle East tensions always play a part with the oil situation. As Aug 22nd nears, the world is going to look on the Iranian nuclear issue. A negative tone on this situation could always effect oil. ¶ 10:48:00 AM 0 comments
![[Most Recent Quotes from www.kitco.com]](http://kitconet.com/charts/metals/gold/t24_au_en_usoz_2.gif)
![[Most Recent Exchange Rate from www.kitco.com]](http://www.weblinks247.com/exrate/24hr-euro-small.gif)