Financial Market Analysis
By Shawn R. Carpenter
Monday, February 27, 2006
EURUSD....
The markets are testing multi-year resistance levels! As we see stocks gain, we must continue to watch if there is any support for this move. Crude Oil fell back to 61.00 on easing fears if the Iran Nuclear crisis (read below). While the S&P 500 rallied to multi-year highs, it sold off towards the close on higher volume. The main concept to watch out for is the pace of this short-term rally. If prices of stocks continue to rise, we might see some capitulation from some of the short sellers, which would send this market into overdrive. Short covering would push prices into rally mode. Although geopolitical tensions seemed to have eased, it is still not clear where we are headed with the Iran nuclear situation. I believe the major players in the situation will tend to view Iran's current negotiations with Russia as a stalling tactic, leading to yet further issues concerning this matter. A continued inverted yield curve will only lead to weakened economic conditions for the economy down the road. As this earnings season begins to wrap up, what will be the immediate influences on the market? Will it be projected corporate earnings based on the American consumer or geopolitical issues. Time will tell...
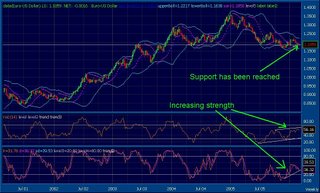
The above chart shows the EUR/USD contract. We can see that support on the 1.18-1.19 level has been reached. Further oscillators suggest that the price may rebound towards a short-term price of 1.25:
1)The 14 day Relative Strength oscillator is suggesting the 2005 downtrend might be over.
2)The stochastic reading is also pointing a firming of the contract.
It must also be noted that as Venezuela and Iran continue to go against the grain with the United States. Recommendations that the price of Oil be traded in Euro's rather than the US Dollar would have a deep impact on the US public. a It is all speculation at this point, we must continue to watch the markets and make decisions as they pan out. ¶ 5:20:00 PM 0 comments


The markets are testing multi-year resistance levels! As we see stocks gain, we must continue to watch if there is any support for this move. Crude Oil fell back to 61.00 on easing fears if the Iran Nuclear crisis (read below). While the S&P 500 rallied to multi-year highs, it sold off towards the close on higher volume. The main concept to watch out for is the pace of this short-term rally. If prices of stocks continue to rise, we might see some capitulation from some of the short sellers, which would send this market into overdrive. Short covering would push prices into rally mode. Although geopolitical tensions seemed to have eased, it is still not clear where we are headed with the Iran nuclear situation. I believe the major players in the situation will tend to view Iran's current negotiations with Russia as a stalling tactic, leading to yet further issues concerning this matter. A continued inverted yield curve will only lead to weakened economic conditions for the economy down the road. As this earnings season begins to wrap up, what will be the immediate influences on the market? Will it be projected corporate earnings based on the American consumer or geopolitical issues. Time will tell...
The above chart shows the EUR/USD contract. We can see that support on the 1.18-1.19 level has been reached. Further oscillators suggest that the price may rebound towards a short-term price of 1.25:
1)The 14 day Relative Strength oscillator is suggesting the 2005 downtrend might be over.
2)The stochastic reading is also pointing a firming of the contract.
It must also be noted that as Venezuela and Iran continue to go against the grain with the United States. Recommendations that the price of Oil be traded in Euro's rather than the US Dollar would have a deep impact on the US public. a It is all speculation at this point, we must continue to watch the markets and make decisions as they pan out. ¶ 5:20:00 PM 0 comments
Friday, February 24, 2006
Mail Order Catalog Sector??

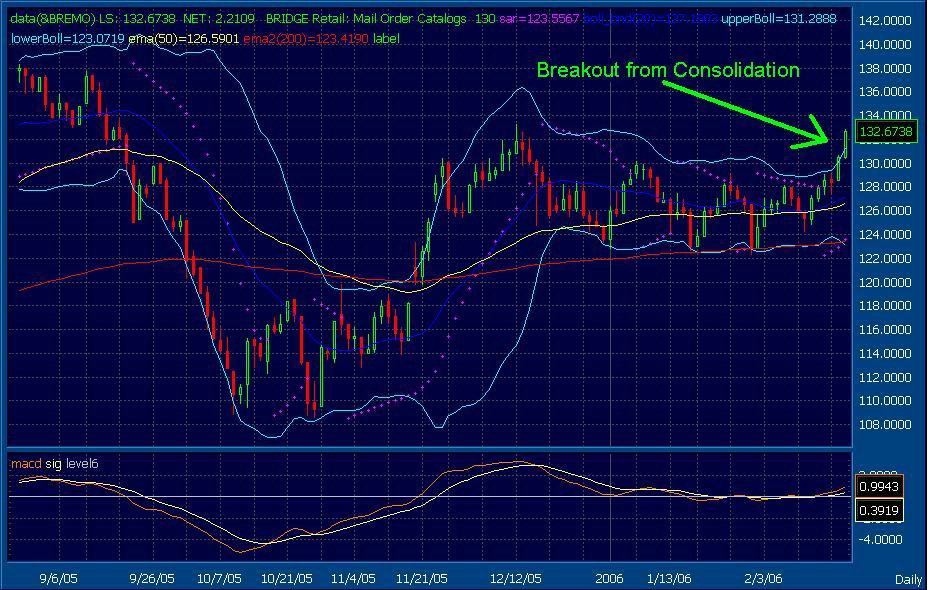
The Bridge Mail Order Catalog Sector (provided by Reuters Group plc.) seems to be breaking through some resistance levels as of late. Consolidation in the 123-132 range (Dec. '05 - Feb. '06) seems to be over and it is moving towards the upside. Recent price activity has broken above the upper Bollinger Band and should continue to move higher. Next major resistance level 138 could be tested in the next few weeks. Some of the major names in this sector are:
Blair Corporation (BL)
Collegiate Pacific Inc. (BOO)
Cabela's Inc. (CAB)
Coldwater Creek Inc. (CWTR)
J.Jill Group (JILL)
Excelligence Learning Corp. (LRNS)
PC Mall Inc. (MALL)
Mediabay Inc. (MBAY)
School Specialty (SCHS)
Sportsman Guide Inc. (SGDE)
Systemax Inc. (SYX)
However, we must note that the market as a whole seems to have found resistance in its rally. While we have seen multi-year highs on some of the major indexes (Dow Industrial Average hit a high of 11159.18, first time over 11,000 since 2001) the market has not responded to the upside with breadth. Geopolitical concerns weigh heavily on investors minds going forward; mainly:
1) Iraq
2) Iran
3) Oil situation in Nigeria and Saudi Arabia
4) The Islamic nation's response to the cartoon situation
The Yield Curve continues to be inverted. Shorter term treasuries are yielding higher than longer term treasuries. This could bode negative consequences for the economy in the near-term future (Take a look at the Yield Curve Chart from 2/13/06). ¶ 11:24:00 AM 0 comments
Friday, February 17, 2006
Gold 2/17/2006

The recent slide in gold seems to have held its upward trend. The yellow trend lines in the chart above suggest that Gold still is in a bullish rally and might go higher. Great consumer spending numbers out the other day led the markets higher, yet today's PPI number (the calculation of how producers in the country decide to sell their goods, primarily due to their costs to make the goods) suggests that inflation is still a concern. Take a look at my updated chart of the 2/10 year yield curve inversion rate and you can see that the inversion in 2000 resulted in a major S&P 500 index decline. This happened before the 9/11 attacks and terrorism issues which affected the markets. As of late December 2005, another inversion has taken place which can produce a similar effect. Another issue is that we have yet to see this market put in big gains to the upside. While we have solid gains in the major averages, resistance might stall a rally. As the markets are off on Monday, we have a long weekend to see how geopolitical issues will pan out (mainly the situation in Nigeria) for the markets. ¶ 4:13:00 PM 0 comments

The recent slide in gold seems to have held its upward trend. The yellow trend lines in the chart above suggest that Gold still is in a bullish rally and might go higher. Great consumer spending numbers out the other day led the markets higher, yet today's PPI number (the calculation of how producers in the country decide to sell their goods, primarily due to their costs to make the goods) suggests that inflation is still a concern. Take a look at my updated chart of the 2/10 year yield curve inversion rate and you can see that the inversion in 2000 resulted in a major S&P 500 index decline. This happened before the 9/11 attacks and terrorism issues which affected the markets. As of late December 2005, another inversion has taken place which can produce a similar effect. Another issue is that we have yet to see this market put in big gains to the upside. While we have solid gains in the major averages, resistance might stall a rally. As the markets are off on Monday, we have a long weekend to see how geopolitical issues will pan out (mainly the situation in Nigeria) for the markets. ¶ 4:13:00 PM 0 comments
Tuesday, February 14, 2006
Consumers step up to the plate in Jan. '06
The American public never disappoints! Recent retail sales numbers from Jan. '06 have risen to 2.2 %(excluding auto sales), up substantially from an estimated 0.9% and last months number of 0.4%. What does this mean? It means that people are willing to spend money on anything from high tech items to daily staples. The market did indeed react well to this number. The Dow drove past 11,000 and oil fell below $60 per barrel, both of which are huge psychological levels. With a number this big, the market took a leap forward probably due to short covering. I'll dig some more and be back with more research....
¶ 4:11:00 PM 0 comments
Monday, February 13, 2006
Yield Curve Inversion
The current market conditions are dictating that money flow into equities is very lackluster. As for the year, the market did rally as funds put a small portion of capital into equities. Yet we still have yet to see a large amount of capital being put to use on for money market funds. The link on this post's title will lead you to Investment Company Institutes (ICI) statistical research on where money is flowing. According to ICI, in Dec. 2005 money was pouring into money market accounts at a 3% pace over the prior month. This suggests that profits are being taken and safeguarded against interest rate developments (Bernanke is speaking on Wed.) as well as geopolitical tensions.
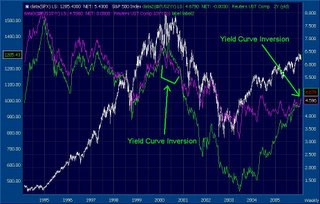
Looking at the chart above, the yield inversion between the 10 Year (white) and 2 Year (green) notes is shown at two different periods. The first period, roughly the whole year of 2000, show that the 2 year yield has risen above the 10 year yield. This pattern suggests that a possible recession lies ahead. Over time, this idea was proven by the lack luster performance of the economy from 2001 to 2003. The second period is the current state of the yield curves. Beginning in late Dec. 2005, this inversion seems to be gaining some momentum. If we see a continued inversion pattern between the 2 yield curves, 2006 might be a year of less than forecasted growth. It still needs to be determined if the economy can shrug this off, as some have suggested that this inversion means nothing. Seems like the late 90's tech rally when people said EPS and PE Ratios should be tossed aside. Follow the trend folks. ¶ 1:56:00 PM 0 comments

The current market conditions are dictating that money flow into equities is very lackluster. As for the year, the market did rally as funds put a small portion of capital into equities. Yet we still have yet to see a large amount of capital being put to use on for money market funds. The link on this post's title will lead you to Investment Company Institutes (ICI) statistical research on where money is flowing. According to ICI, in Dec. 2005 money was pouring into money market accounts at a 3% pace over the prior month. This suggests that profits are being taken and safeguarded against interest rate developments (Bernanke is speaking on Wed.) as well as geopolitical tensions.
Looking at the chart above, the yield inversion between the 10 Year (white) and 2 Year (green) notes is shown at two different periods. The first period, roughly the whole year of 2000, show that the 2 year yield has risen above the 10 year yield. This pattern suggests that a possible recession lies ahead. Over time, this idea was proven by the lack luster performance of the economy from 2001 to 2003. The second period is the current state of the yield curves. Beginning in late Dec. 2005, this inversion seems to be gaining some momentum. If we see a continued inversion pattern between the 2 yield curves, 2006 might be a year of less than forecasted growth. It still needs to be determined if the economy can shrug this off, as some have suggested that this inversion means nothing. Seems like the late 90's tech rally when people said EPS and PE Ratios should be tossed aside. Follow the trend folks. ¶ 1:56:00 PM 0 comments
Wednesday, February 08, 2006
Waste Management
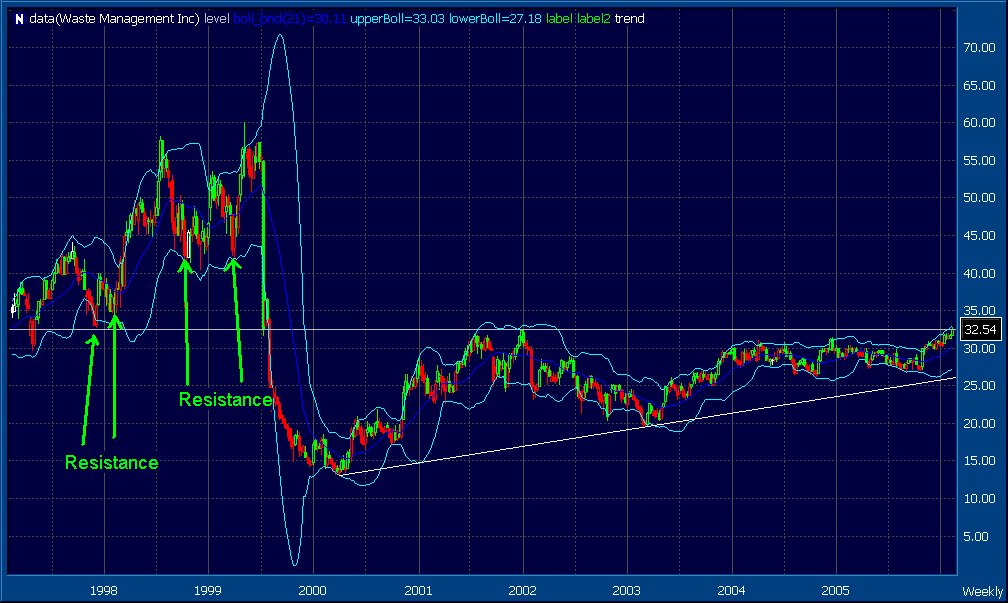
Waste Management Incorporated seems to be breaking through its recent consolidation period. Rangebound over the last 2 years between 34.40 and 27.00, consolidation is over and it is moving to the upside (as of 2/8/06 - 32.54). It will be interesting to see if it breaks through the resistance levels of 32.62 (week of 12/6/97) and 34.44 (week of 2/7/98).
 ¶ 6:13:00 PM 0 comments
 ¶ 6:13:00 PM 0 comments
Tuesday, February 07, 2006
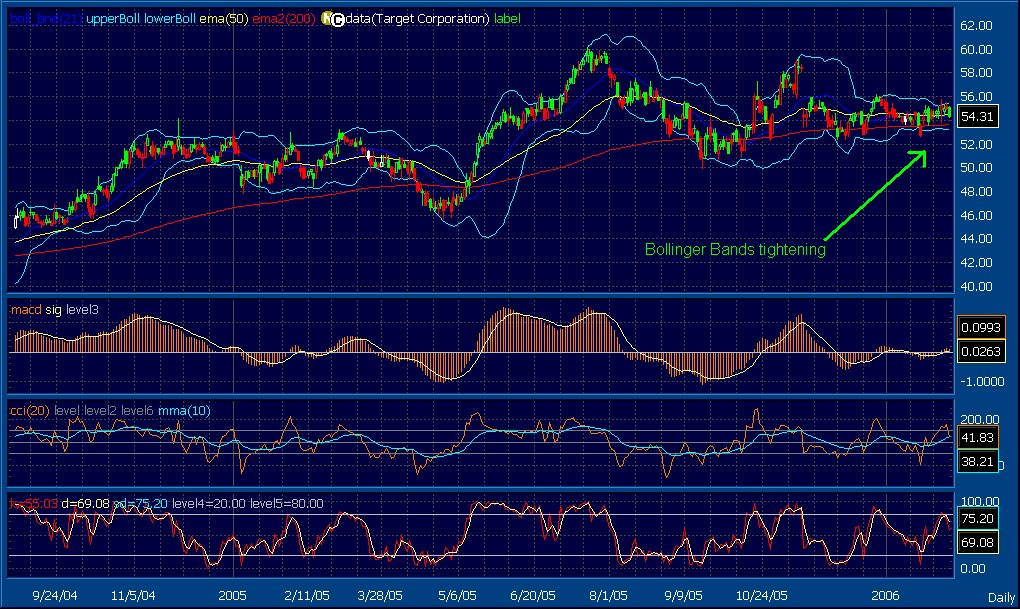
Target Corporation
Target Corporation could possibly break out one way or the other soon. Bollinger Bands are tightening. This classic pattern suggests that there will be a major move, either to the upside or downside. Volatility has dried up and the price has been stuck in a small trading range as of lately. Time will only tell when it breaks. Major support levels are 53.70 and 47.40. Resistance levels are 58.90, 59.29, and 60.
 ¶ 9:50:00 PM 0 comments
 ¶ 9:50:00 PM 0 comments
Friday, February 03, 2006
A Possible East vs. West scenario
The recent spat over the Islamic resistance to the Danish photo of the Prophet Mohammad in a “bomb turban” has given rise to a possible New World Order. Across the headlines of major newspapers of the world, the people of Islamic countries are very upset about this development and are in the process of banning Western goods and services. There seems to be a real, identifiable resentment to the West over this issue. People in Islamic nations are moving towards a pro-Eastern stance. As this story is developing, it is going to be interesting to see what ideology will become out of this, especially on the threshold of a global effort to deal with the Iranian nuclear confrontation. I will notify you of any developments on this front.
¶ 1:37:00 PM 0 comments
Consumer Weakness?
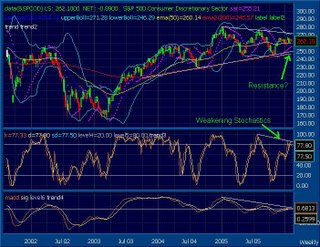
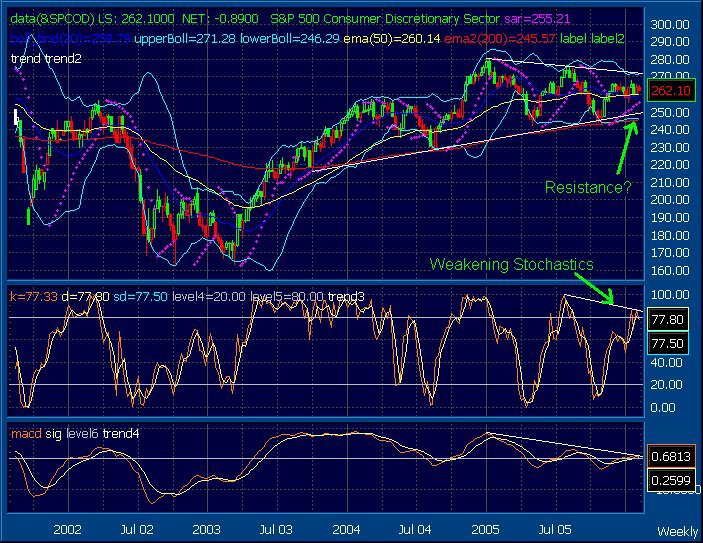
The S&P 500 Consumer Discretionary Sector seems to be going through a tough period. Recent concerns about the U.S. consumer being able to sustain the buying activity in 2006 maybe coming to fruition.
The homes sales data of as lately seems to suggest that fewer people are buying houses, even though interests are considerably lower from previous years. Housing starts have increased in Dec. 2005 to 1.9 (mln) from 2.12 (mln) in Nov. 2005. Yet the forecast for New Home sales for Dec. 2005 are expected to decrease from the Nov. 2005 number. While it a seasonally slow time for home sales, we must be concerned about this possible setback to our economy. Over the last couple of years, home owners have sought refinancing as a means to access more money. At lower interest rates, this makes sense for those who have had high mortgage rates. Yet, while homeowners begin to take on more debt, they might not have money to sustain their discretionary buying. Money being borrowed against the cost of homes to pay for new cars, home remodeling, and discretionary spending (buying electronics, luxury goods, etc.)will take its toll on the US public. Money will be conserved for staples such as gas, food, etc.
The chart above suggest that the S&P Discretionary Sector might be headed lower. Resistance might be an issue as the sector begins to consolidate. Price studies have shown that the sector's 21 day slow stochastic is weakening, and the moving averages are beginning to tighten. More time will be needed to determine the actual course of the economy. ¶ 10:15:00 AM 0 comments
![[Most Recent Quotes from www.kitco.com]](http://kitconet.com/charts/metals/gold/t24_au_en_usoz_2.gif)
![[Most Recent Exchange Rate from www.kitco.com]](http://www.weblinks247.com/exrate/24hr-euro-small.gif)