Financial Market Analysis
By Shawn R. Carpenter
Tuesday, October 24, 2006
Volume hints at the future

Studying volume is a critical aspect of technical analysis. It gives insight into how a particular asset is being viewed to market participants, either buy more because it is cheap or buy less because it is high. This basic principle should be applied to market movements in determining if a security or asset is about to turn or reverse its trending course. While the Dow Jones Industrial Average is breaking all times highs, is this a real rally? Looking over my previous posts as well as the chart above, this market has NOT been defined as an all out bull rally in a traditional technical analysis approach. We need to dig deeper to understand what is going on here.
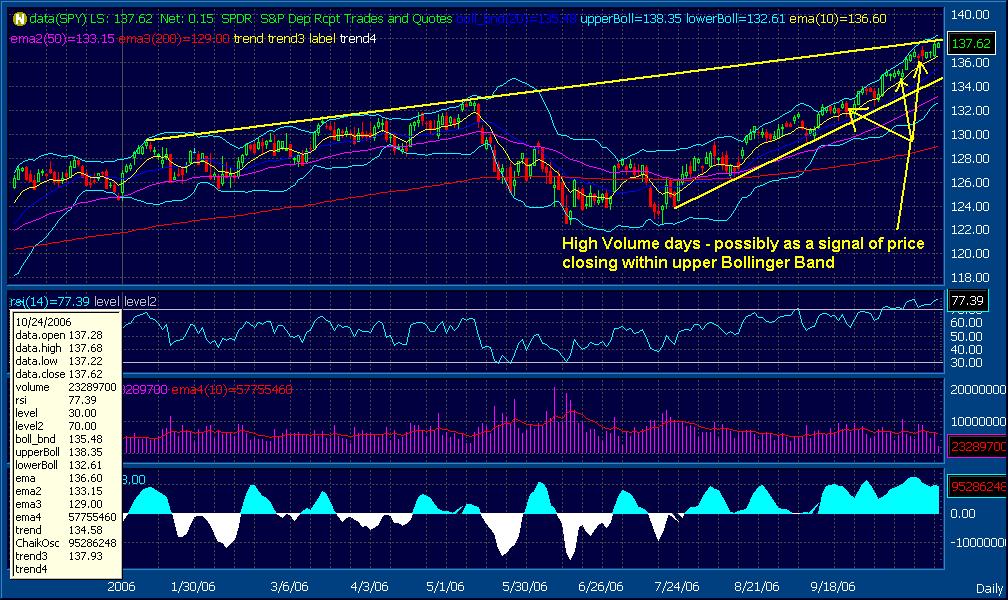
The chart above shows the S&P 500 ETF (SPY). Right off the bat, we can notice that in the last month or so of trading sessions, the price has been in a rally mode but it hasn't broken its upward trending resistance levels. Set in motion in the latter months of 2005, this upward trend channel has been in place while the DJIA has risen to all time highs. One would expect that a major rally would include the SPYs, as it tracks a higher concentration of the overall market (covers 500 stocks rather than the DJIA 30). Digging yet deeper, we can see that since 9/26/2006, the volume on the SPY has been lagging its own average. Look at the data below (data provided by REUTERS):

Not including today, we can see the SPY average volume for 14 out of the last 21 days has been below its 10 Day Average Volume. For the 30 Day Average Volume, 12 of the last 21 days has been below average. Noting this, we can say that this rally in the SPYs has been little about market participation and investment opportunity and more about reaction to the DJIA move. Furthermore, from the close of 9/24 till 10/23, the SPY has made a 6 point move higher. Of this 6 point move, the 7 days on which the market had more volume than its average, the gains were only 2.6 points. Please note the chart as these days are possibly signs that price action might close within the upper Bollinger Band. On the other side, gains on the other days in which volume was lower than its moving average were 3.4.
Lighter volume days are in essence pushing the market higher. When money is being put to work, the SPY is not making progress. To me, it seems as if there is shorting going on the days when more volume is prevalent. The sellers are not being very aggressive, rather just putting offers out there and getting filled.
As we also are in the mist of earnings season and a fed decision tomorrow, it will be interesting to see how the markets shape up in the near future. Boosting the economy is the fact that consumer spending might be bolstered by lower costs at the gas pumps, possibly making for a nice Christmas shopping season. However, while this may be all dandy, we still have no resolutions or clear insight into the Iranian and North Korean nuclear issues. While there are people out there saying that international issues are currently not hurting the markets, they are just trying to pull a blanket over the issue and let the market run. These are serious issues which will come back into the fray once they get down to the wire. Good luck to you all.... ¶ 11:04:00 AM 0 comments

Studying volume is a critical aspect of technical analysis. It gives insight into how a particular asset is being viewed to market participants, either buy more because it is cheap or buy less because it is high. This basic principle should be applied to market movements in determining if a security or asset is about to turn or reverse its trending course. While the Dow Jones Industrial Average is breaking all times highs, is this a real rally? Looking over my previous posts as well as the chart above, this market has NOT been defined as an all out bull rally in a traditional technical analysis approach. We need to dig deeper to understand what is going on here.
The chart above shows the S&P 500 ETF (SPY). Right off the bat, we can notice that in the last month or so of trading sessions, the price has been in a rally mode but it hasn't broken its upward trending resistance levels. Set in motion in the latter months of 2005, this upward trend channel has been in place while the DJIA has risen to all time highs. One would expect that a major rally would include the SPYs, as it tracks a higher concentration of the overall market (covers 500 stocks rather than the DJIA 30). Digging yet deeper, we can see that since 9/26/2006, the volume on the SPY has been lagging its own average. Look at the data below (data provided by REUTERS):

Not including today, we can see the SPY average volume for 14 out of the last 21 days has been below its 10 Day Average Volume. For the 30 Day Average Volume, 12 of the last 21 days has been below average. Noting this, we can say that this rally in the SPYs has been little about market participation and investment opportunity and more about reaction to the DJIA move. Furthermore, from the close of 9/24 till 10/23, the SPY has made a 6 point move higher. Of this 6 point move, the 7 days on which the market had more volume than its average, the gains were only 2.6 points. Please note the chart as these days are possibly signs that price action might close within the upper Bollinger Band. On the other side, gains on the other days in which volume was lower than its moving average were 3.4.
Lighter volume days are in essence pushing the market higher. When money is being put to work, the SPY is not making progress. To me, it seems as if there is shorting going on the days when more volume is prevalent. The sellers are not being very aggressive, rather just putting offers out there and getting filled.
As we also are in the mist of earnings season and a fed decision tomorrow, it will be interesting to see how the markets shape up in the near future. Boosting the economy is the fact that consumer spending might be bolstered by lower costs at the gas pumps, possibly making for a nice Christmas shopping season. However, while this may be all dandy, we still have no resolutions or clear insight into the Iranian and North Korean nuclear issues. While there are people out there saying that international issues are currently not hurting the markets, they are just trying to pull a blanket over the issue and let the market run. These are serious issues which will come back into the fray once they get down to the wire. Good luck to you all.... ¶ 11:04:00 AM 0 comments
Thursday, October 19, 2006
Revisiting the Bond ETFs

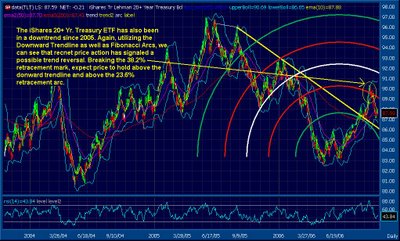
Revisiting the Bond ETFs, we see some striking price action going on recently. In the charts above, IEF (Ishares Lehman 7-10 Yr. Treasury ETF) and TLT (Ishares Lehman Treasury 20+ year ETF) have both been in a downtrend since 2005. As the price action has declined, yields have strengthened; consistent with Fed rate hikes. While the equity market has seen recent gains mainly attributed to the Dow Jones Industrial Average leading the way, as well as positive (spotty) earnings reports, the overall sentiment of the markets has been in bullish mode. Yet, traditional Dow Theory followers will note that the Dow Jones Transportation has not reached its previous high set on May 10, 2006 and might not. Current equity market speculation has been supported DOW 12K hopes (which it did recently and sold off since). If this market was really a bull market, I would expect a HUGE short covering rally and an influx of money on the sidelines to propel the average (as well as SPX) up and beyond 12K. With regards to this, I am looking at the bond market to gauge if this is a true equity rally.
While the bond market has been a notable downtrend, we can see that recent price action could lend to the idea that gains in the equity realm might be put to work in the bond market. Given Fibonacci Arcs as a clue of a price reversal, we see that both ETFs have seen price action rise above the 28.3% retracement line in late September. While there needs to be more time to confirm if such a trend reversal should appear, look for price action to sustain above the yellow trendlines of both vehicles as a clue. ¶ 12:28:00 PM 0 comments
Monday, October 16, 2006
Middle East Battle for Oct-Nov???
The winds of war are silent in the media, but they are out there.
Iran has just declared war against Israel and the US. It wasn't that long ago when a man named Osama bin Laden and the Al-Qaeda organization declared the same proclamation against us.
The US is gearing up for a war games with other Middle Eastern allies scheduled to start at the end of October. The USS Eisenhower Carrier Strike Group is making its way to the Persian Gulf to participate in this matter. That would beef up an already US presence in the Gulf due to the war in Iraq. As this unfolds, it will be interesting to see what reaction Iran will take upon this mock military exercise. As Debka.com reports, Iran might be prepared to take this opportunity to strike out at the US (click on the title of this post to see the Debka.com article).
What will this mean for the markets? Well this all depends on whether or not Iran takes action. The Iranian nuclear situation has already been forwarded to the UN Security Council to decide the fate of this dilemma. Iran has repeatedly said in the past that this course of action would be detrimental to negotiations. Should Iran attack this US/Allied war games, I would suspect Oil to break out of this current range. Gold (see previous post) would also rally as a possible war would escalate into reality. The current equity market rally would be cut short and a defensive posture would be the norm among market players. In short, it would be prudent to play the "very short term" on SELECT equities given earnings season is still happening. Yet it would be very prudent to remain cautious as to the undertones of what might transpire in the near future.
Be careful out there, utilize strict risk management techniques, and be wise to take note of possible developing actions. ¶ 3:15:00 PM 0 comments
Gold as an alternative option

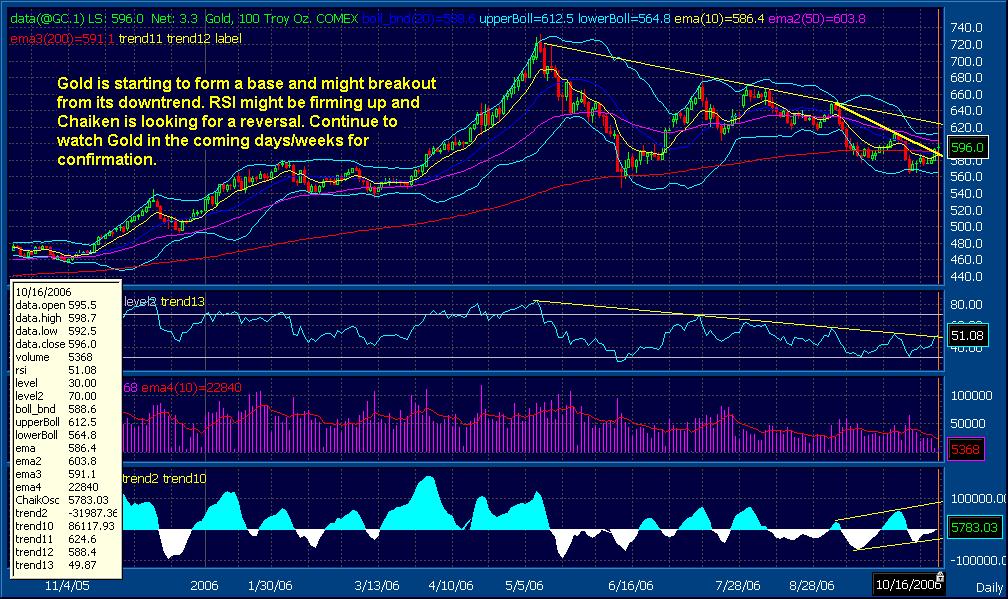
The price of Gold has been consolidating from its high on 5/12/06. Coming from a high price of roughly $721.00, it has been sold down its current level of $598.00. This move of roughly 129 points, or a downward move of 17.7%. Considering this, you will see on the chart above that a support level of 560 to 576 has been sustained on the short term. Price action for Sept-Oct.'06 has remained in-line with the support level of June'06. While the Dow Jones Industrial Average has taken off, leaving a bearish divergence from the traditional Dow Theory, one might take some caution here and place some safe bets on Gold. Also, considering that the international political arena is rife with tensions from North Korea and Iran, gold might be an option for people to put recently gained equity profits to work in the near future.
The oscillators also tell of some interesting signals. The RSI for gold is turning upward and might break the downward bias it has been on since May-June'06. The coming days/weeks will confirm if a gold rally is evident. The Chaiken oscillator is also suggesting that money has been moving into gold at these levels. The channel in the Chaiken oscillator pointed out in the chart above might suggest that the sell off might end soon and buyers might be coming back into the fray. Yet again, the coming price action and technicals must be followed in the coming days/weeks to confirm this bullish trend reversal.
It might be wise to buy some of the underlying companies with in this sector as well, before the street begins to see this turn of events. Some names to look out for would be:
NTO - Northern Orion Resources Inc.
AEM - Agnico Eagle Mines Ltd.
ABX - Barrick Gold Corp.
PAAS - Pan American Silver Corp.
RNO - Rio Narcea Gold Mines Inc.
SA - Seabridge Gold Inc.
VGZ - Vista Gold Corp.
OZN - OreZone Res. Inc. ¶ 12:28:00 PM 0 comments
![[Most Recent Quotes from www.kitco.com]](http://kitconet.com/charts/metals/gold/t24_au_en_usoz_2.gif)
![[Most Recent Exchange Rate from www.kitco.com]](http://www.weblinks247.com/exrate/24hr-euro-small.gif)