Financial Market Analysis
By Shawn R. Carpenter
Tuesday, October 24, 2006
Volume hints at the future

Studying volume is a critical aspect of technical analysis. It gives insight into how a particular asset is being viewed to market participants, either buy more because it is cheap or buy less because it is high. This basic principle should be applied to market movements in determining if a security or asset is about to turn or reverse its trending course. While the Dow Jones Industrial Average is breaking all times highs, is this a real rally? Looking over my previous posts as well as the chart above, this market has NOT been defined as an all out bull rally in a traditional technical analysis approach. We need to dig deeper to understand what is going on here.
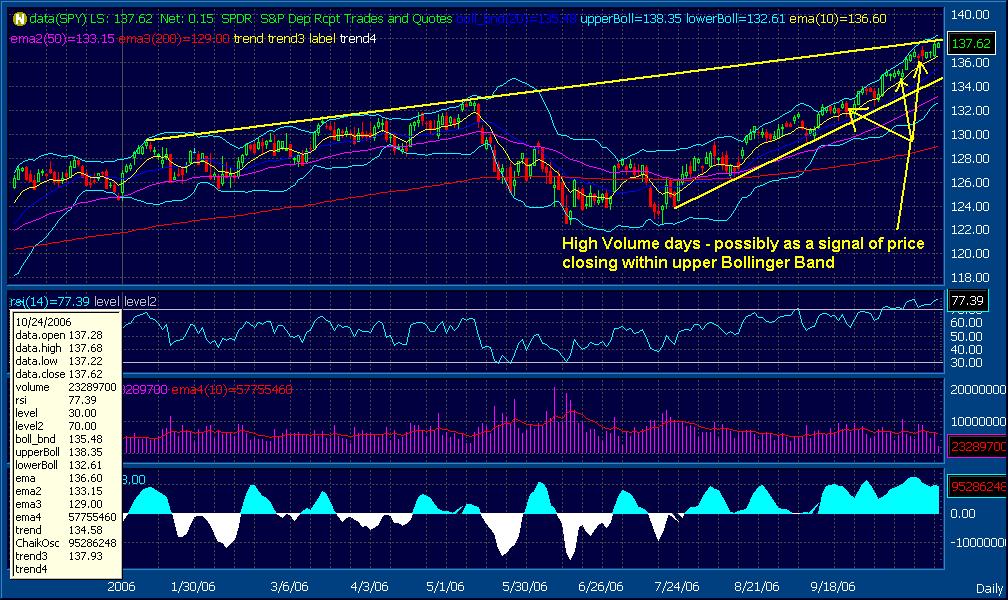
The chart above shows the S&P 500 ETF (SPY). Right off the bat, we can notice that in the last month or so of trading sessions, the price has been in a rally mode but it hasn't broken its upward trending resistance levels. Set in motion in the latter months of 2005, this upward trend channel has been in place while the DJIA has risen to all time highs. One would expect that a major rally would include the SPYs, as it tracks a higher concentration of the overall market (covers 500 stocks rather than the DJIA 30). Digging yet deeper, we can see that since 9/26/2006, the volume on the SPY has been lagging its own average. Look at the data below (data provided by REUTERS):

Not including today, we can see the SPY average volume for 14 out of the last 21 days has been below its 10 Day Average Volume. For the 30 Day Average Volume, 12 of the last 21 days has been below average. Noting this, we can say that this rally in the SPYs has been little about market participation and investment opportunity and more about reaction to the DJIA move. Furthermore, from the close of 9/24 till 10/23, the SPY has made a 6 point move higher. Of this 6 point move, the 7 days on which the market had more volume than its average, the gains were only 2.6 points. Please note the chart as these days are possibly signs that price action might close within the upper Bollinger Band. On the other side, gains on the other days in which volume was lower than its moving average were 3.4.
Lighter volume days are in essence pushing the market higher. When money is being put to work, the SPY is not making progress. To me, it seems as if there is shorting going on the days when more volume is prevalent. The sellers are not being very aggressive, rather just putting offers out there and getting filled.
As we also are in the mist of earnings season and a fed decision tomorrow, it will be interesting to see how the markets shape up in the near future. Boosting the economy is the fact that consumer spending might be bolstered by lower costs at the gas pumps, possibly making for a nice Christmas shopping season. However, while this may be all dandy, we still have no resolutions or clear insight into the Iranian and North Korean nuclear issues. While there are people out there saying that international issues are currently not hurting the markets, they are just trying to pull a blanket over the issue and let the market run. These are serious issues which will come back into the fray once they get down to the wire. Good luck to you all.... ¶ 11:04:00 AM

Studying volume is a critical aspect of technical analysis. It gives insight into how a particular asset is being viewed to market participants, either buy more because it is cheap or buy less because it is high. This basic principle should be applied to market movements in determining if a security or asset is about to turn or reverse its trending course. While the Dow Jones Industrial Average is breaking all times highs, is this a real rally? Looking over my previous posts as well as the chart above, this market has NOT been defined as an all out bull rally in a traditional technical analysis approach. We need to dig deeper to understand what is going on here.
The chart above shows the S&P 500 ETF (SPY). Right off the bat, we can notice that in the last month or so of trading sessions, the price has been in a rally mode but it hasn't broken its upward trending resistance levels. Set in motion in the latter months of 2005, this upward trend channel has been in place while the DJIA has risen to all time highs. One would expect that a major rally would include the SPYs, as it tracks a higher concentration of the overall market (covers 500 stocks rather than the DJIA 30). Digging yet deeper, we can see that since 9/26/2006, the volume on the SPY has been lagging its own average. Look at the data below (data provided by REUTERS):

Not including today, we can see the SPY average volume for 14 out of the last 21 days has been below its 10 Day Average Volume. For the 30 Day Average Volume, 12 of the last 21 days has been below average. Noting this, we can say that this rally in the SPYs has been little about market participation and investment opportunity and more about reaction to the DJIA move. Furthermore, from the close of 9/24 till 10/23, the SPY has made a 6 point move higher. Of this 6 point move, the 7 days on which the market had more volume than its average, the gains were only 2.6 points. Please note the chart as these days are possibly signs that price action might close within the upper Bollinger Band. On the other side, gains on the other days in which volume was lower than its moving average were 3.4.
Lighter volume days are in essence pushing the market higher. When money is being put to work, the SPY is not making progress. To me, it seems as if there is shorting going on the days when more volume is prevalent. The sellers are not being very aggressive, rather just putting offers out there and getting filled.
As we also are in the mist of earnings season and a fed decision tomorrow, it will be interesting to see how the markets shape up in the near future. Boosting the economy is the fact that consumer spending might be bolstered by lower costs at the gas pumps, possibly making for a nice Christmas shopping season. However, while this may be all dandy, we still have no resolutions or clear insight into the Iranian and North Korean nuclear issues. While there are people out there saying that international issues are currently not hurting the markets, they are just trying to pull a blanket over the issue and let the market run. These are serious issues which will come back into the fray once they get down to the wire. Good luck to you all.... ¶ 11:04:00 AM
![[Most Recent Quotes from www.kitco.com]](http://kitconet.com/charts/metals/gold/t24_au_en_usoz_2.gif)
![[Most Recent Exchange Rate from www.kitco.com]](http://www.weblinks247.com/exrate/24hr-euro-small.gif)