Financial Market Analysis
By Shawn R. Carpenter
Sunday, January 22, 2006
Iran issue weighs on markets
The Iran nuclear issue continues to expand and a resolution might not be in sight. Both sides are adamant about their positions and will stick by them even if it means war.
The Fed should raise interest rates during the first meeting of 2006 mainly due to the raise in commodity prices. The price of March '06 oil futures, for example, is closing in on the 8/31/05 high of 70.85 per barrel. The results of corporate earnings from 4Q05 is starting off on a bad footing. Coupled these issues with the Iran situation, Wall Street is beginning to take profits to lock in the gains should they not come later in the year.
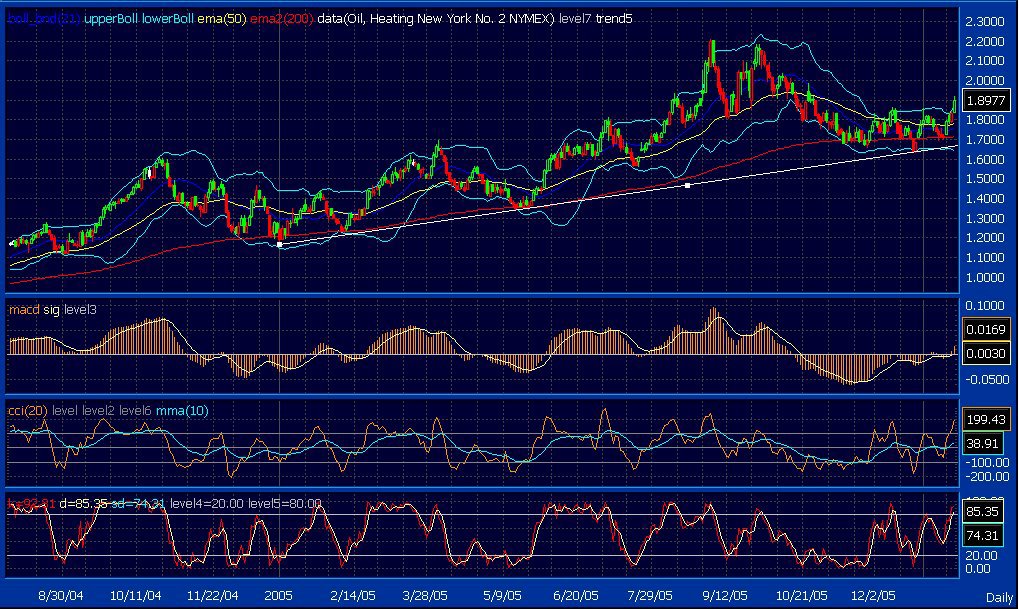
All this said, there should be a sign as to where money is flowing since it is being pulled from equities. As I said before, gold as well as other metals will see some of this flow. Looking at the chart below, we can see that Heating Oil (traded on the NYMEX) is advancing. The white trend line shows how the price of heating oil is in an upward trend. The lows in late December have just confirmed the bullish trend and the price is beginning to move higher since its recent move past the early December '05 high around 1.895. As it passed the 1.895 level, we should see some resistance at 2.oo-2.10. Given the economic climate, a price move higher could be expected.

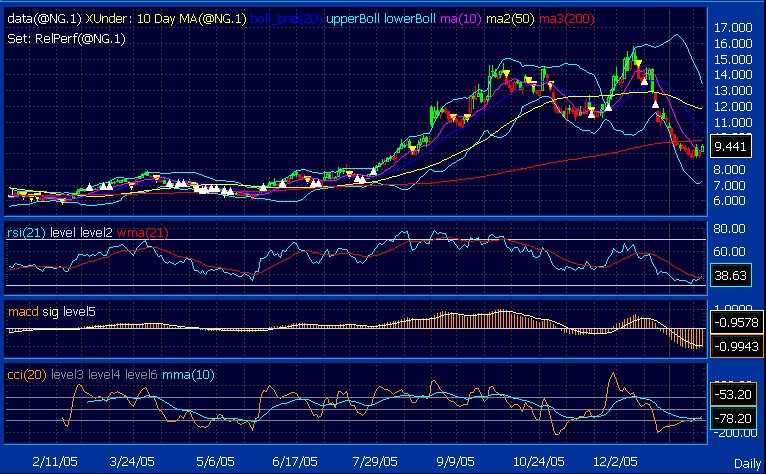
The Natural Gas contract (chart below) has shown some signs of being oversold. While the huge price movement in the last 2 quarters of 2005 are mostly over with, we could still see a trading opportunity here. The recent Commodity Channel Index (CCI) move above the -100 level indicates a buying opportunity. While the downside seems to be limited to $8.00, a price movement to the $10-$12 range should not be ruled out given the current situation the market is in (as discussed above).

Continuing to gather intelligence as to where the market might be headed.... ¶ 2:19:00 PM 0 comments

The Fed should raise interest rates during the first meeting of 2006 mainly due to the raise in commodity prices. The price of March '06 oil futures, for example, is closing in on the 8/31/05 high of 70.85 per barrel. The results of corporate earnings from 4Q05 is starting off on a bad footing. Coupled these issues with the Iran situation, Wall Street is beginning to take profits to lock in the gains should they not come later in the year.
All this said, there should be a sign as to where money is flowing since it is being pulled from equities. As I said before, gold as well as other metals will see some of this flow. Looking at the chart below, we can see that Heating Oil (traded on the NYMEX) is advancing. The white trend line shows how the price of heating oil is in an upward trend. The lows in late December have just confirmed the bullish trend and the price is beginning to move higher since its recent move past the early December '05 high around 1.895. As it passed the 1.895 level, we should see some resistance at 2.oo-2.10. Given the economic climate, a price move higher could be expected.
The Natural Gas contract (chart below) has shown some signs of being oversold. While the huge price movement in the last 2 quarters of 2005 are mostly over with, we could still see a trading opportunity here. The recent Commodity Channel Index (CCI) move above the -100 level indicates a buying opportunity. While the downside seems to be limited to $8.00, a price movement to the $10-$12 range should not be ruled out given the current situation the market is in (as discussed above).
Continuing to gather intelligence as to where the market might be headed.... ¶ 2:19:00 PM 0 comments
Monday, January 16, 2006
S&P 500 (SPX) rally in 2005?

Can the equity markets pull off new all-time highs in 2006?
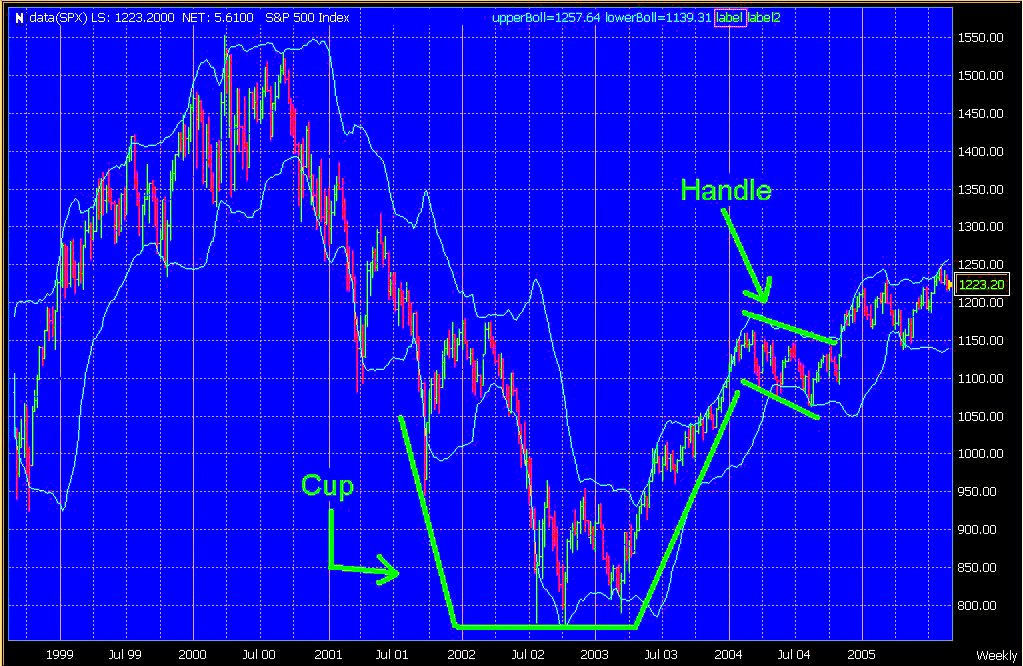
The cup and handle formation is a classic bullish indicator that indicates that the underlying stock, or in this case the SPX index, will be heading in an upward direction. As time unfolded, the SPX index rallied along with the rest of the market at the end of 2005. Based off of this chart, we might see some higher prices going into 2006, but beware the factors of a possbile Iran nuclear conflict, fed rate hikes, and poor corporate earnings outlook. These issues could pose an obstacle for a rally. ¶ 12:47:00 PM 0 comments
Can the equity markets pull off new all-time highs in 2006?
The cup and handle formation is a classic bullish indicator that indicates that the underlying stock, or in this case the SPX index, will be heading in an upward direction. As time unfolded, the SPX index rallied along with the rest of the market at the end of 2005. Based off of this chart, we might see some higher prices going into 2006, but beware the factors of a possbile Iran nuclear conflict, fed rate hikes, and poor corporate earnings outlook. These issues could pose an obstacle for a rally.
¶ 12:47:00 PM 0 comments
Sunday, January 15, 2006
Gold in 2006!
Is Gold going higher?
Technical analysis indicates that gold might reach $700/ troy ounce in 2006. Indicators suggest a slightly overbought recommendation short term, but the demand for gold among foreign markets will continue. There are numerous indications that support a move higher. These range from:
Technical analysis indicates that gold might reach $700/ troy ounce in 2006. Indicators suggest a slightly overbought recommendation short term, but the demand for gold among foreign markets will continue. There are numerous indications that support a move higher. These range from:
- USD weakness going foward
- Gold as a safe haven to the emerging middle class in overseas markets
- Exotic currencies backed by gold reserves
- International political tensions
- Possible supply strains
![[Most Recent Quotes from www.kitco.com]](http://kitconet.com/charts/metals/gold/t24_au_en_usoz_2.gif)
![[Most Recent Exchange Rate from www.kitco.com]](http://www.weblinks247.com/exrate/24hr-euro-small.gif)