Financial Market Analysis
By Shawn R. Carpenter
Sunday, April 23, 2006
The real pain of high gas...
The national average of retail gas prices have climbed to $2.90 ( as of 4/23/06, according to AAA, http://www.fuelgaugereport.com/index.asp ). This is up from last month's average of $2.509. As these prices climb and as people continue to use cars as they used to, money that has been driving this multi-year bull run in the markets will go into the pockets of oil companies rather than the broader sectors of the market. It will be interesting to see Q2'06 corporate earnings, mainly their guidance going forward as well as possible early warnings of missing estimates.
¶ 1:43:00 PM 0 comments


Wednesday, April 19, 2006
CNBC Stock Game...
Commodities are going through the roof!!!
I am still bullish on Gold.. and it's almost half way there. I am looking for a price of $700.00. Considering the red hot sector of the market, we might just get there.
Anyways, sorry for not imforming you all on my recent pickings of the CNBC stock market game, but I've been very busy with other things. I am currently in the top 5% of all players!!! Had a great pick on ICE which went through the roof. Up 10 points on 10k shares. ¶ 9:51:00 PM 0 comments
Tuesday, April 18, 2006
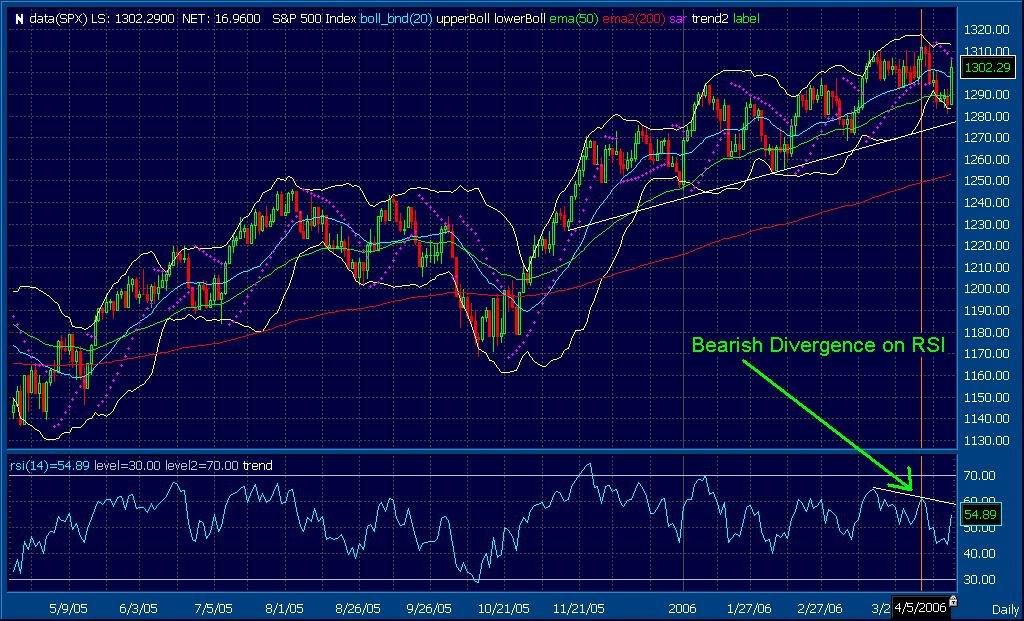
SPX as of 4/18/06
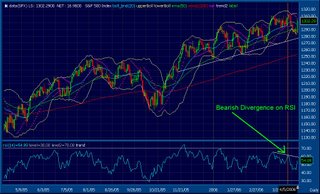
The S&P 500 index seems to be doing well today. Yet it seems to be nearing resistance. As you can see from the chart above, the 14 day RSI is showing a bearish divergence from its price movement over the last couple of weeks. You can see the orange line pointing to the point at which the RSI failed to break the recent point a few weeks ago. The orange line at the price of the SPX failed to break the 1310 level. Look for more resistance as commodities make new yearly highs. ¶ 3:06:00 PM 0 comments
The S&P 500 index seems to be doing well today. Yet it seems to be nearing resistance. As you can see from the chart above, the 14 day RSI is showing a bearish divergence from its price movement over the last couple of weeks. You can see the orange line pointing to the point at which the RSI failed to break the recent point a few weeks ago. The orange line at the price of the SPX failed to break the 1310 level. Look for more resistance as commodities make new yearly highs. ¶ 3:06:00 PM 0 comments
Monday, April 10, 2006
Money Market Flows
Recent money management values are suggesting that money is not being put to work in equities. Around $21 billion has been moved into money market accounts in the past 4 weeks,according to a report from Investment Company Institute. (Double click on the title of this post to see the actual data from the ICI.org webpage.)
Amount of fund in money market account for the week ending:
3/15/06 - $2.04 Trillion
3/22/06 - $2.056 Trillion
3/29/06 - $2.056 Trillion
4/05/06 - $2.061 Trillion
What does this mean? It means that the lagging money managers have realized the dire shape of the current economy and financial markets. By placing money into money-market funds, they are buying tickets on the sidelines of this game and will watch to see what the next play is. More money coming into these accounts will only confirm the current bearish sentiment that the markets are going through. ¶ 7:59:00 AM 0 comments
![[Most Recent Quotes from www.kitco.com]](http://kitconet.com/charts/metals/gold/t24_au_en_usoz_2.gif)
![[Most Recent Exchange Rate from www.kitco.com]](http://www.weblinks247.com/exrate/24hr-euro-small.gif)