Financial Market Analysis
By Shawn R. Carpenter
Tuesday, April 18, 2006
SPX as of 4/18/06
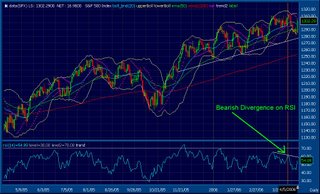
The S&P 500 index seems to be doing well today. Yet it seems to be nearing resistance. As you can see from the chart above, the 14 day RSI is showing a bearish divergence from its price movement over the last couple of weeks. You can see the orange line pointing to the point at which the RSI failed to break the recent point a few weeks ago. The orange line at the price of the SPX failed to break the 1310 level. Look for more resistance as commodities make new yearly highs. ¶ 3:06:00 PM

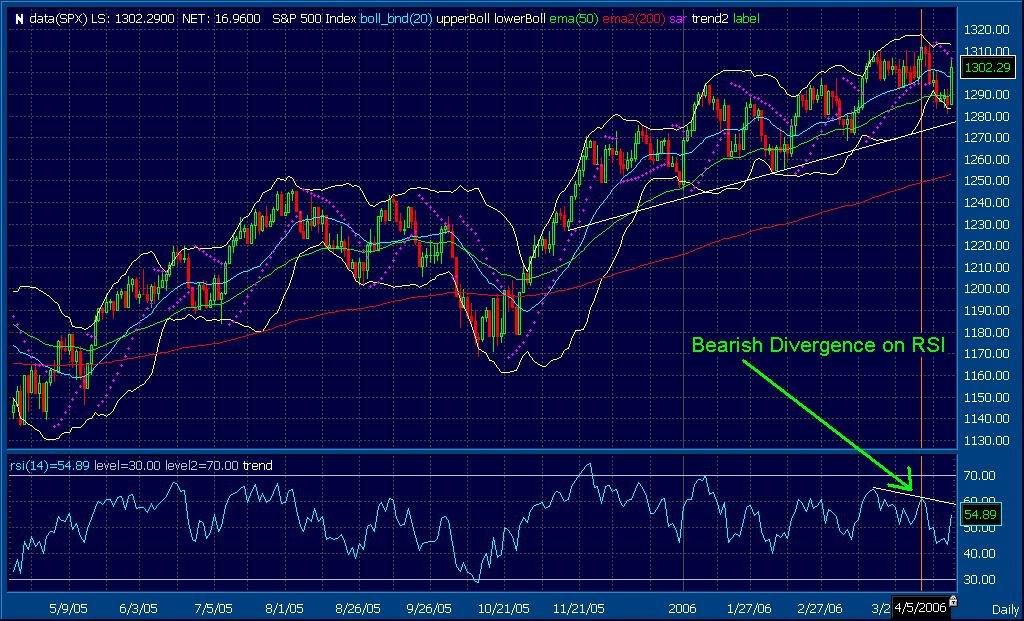
The S&P 500 index seems to be doing well today. Yet it seems to be nearing resistance. As you can see from the chart above, the 14 day RSI is showing a bearish divergence from its price movement over the last couple of weeks. You can see the orange line pointing to the point at which the RSI failed to break the recent point a few weeks ago. The orange line at the price of the SPX failed to break the 1310 level. Look for more resistance as commodities make new yearly highs. ¶ 3:06:00 PM
![[Most Recent Quotes from www.kitco.com]](http://kitconet.com/charts/metals/gold/t24_au_en_usoz_2.gif)
![[Most Recent Exchange Rate from www.kitco.com]](http://www.weblinks247.com/exrate/24hr-euro-small.gif)