Financial Market Analysis
By Shawn R. Carpenter
Thursday, October 19, 2006
Revisiting the Bond ETFs


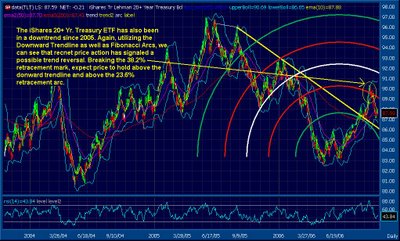
Revisiting the Bond ETFs, we see some striking price action going on recently. In the charts above, IEF (Ishares Lehman 7-10 Yr. Treasury ETF) and TLT (Ishares Lehman Treasury 20+ year ETF) have both been in a downtrend since 2005. As the price action has declined, yields have strengthened; consistent with Fed rate hikes. While the equity market has seen recent gains mainly attributed to the Dow Jones Industrial Average leading the way, as well as positive (spotty) earnings reports, the overall sentiment of the markets has been in bullish mode. Yet, traditional Dow Theory followers will note that the Dow Jones Transportation has not reached its previous high set on May 10, 2006 and might not. Current equity market speculation has been supported DOW 12K hopes (which it did recently and sold off since). If this market was really a bull market, I would expect a HUGE short covering rally and an influx of money on the sidelines to propel the average (as well as SPX) up and beyond 12K. With regards to this, I am looking at the bond market to gauge if this is a true equity rally.
While the bond market has been a notable downtrend, we can see that recent price action could lend to the idea that gains in the equity realm might be put to work in the bond market. Given Fibonacci Arcs as a clue of a price reversal, we see that both ETFs have seen price action rise above the 28.3% retracement line in late September. While there needs to be more time to confirm if such a trend reversal should appear, look for price action to sustain above the yellow trendlines of both vehicles as a clue.
![[Most Recent Quotes from www.kitco.com]](http://kitconet.com/charts/metals/gold/t24_au_en_usoz_2.gif)
![[Most Recent Exchange Rate from www.kitco.com]](http://www.weblinks247.com/exrate/24hr-euro-small.gif)

