Financial Market Analysis
By Shawn R. Carpenter
Wednesday, August 02, 2006
Light Sweet Crude.....

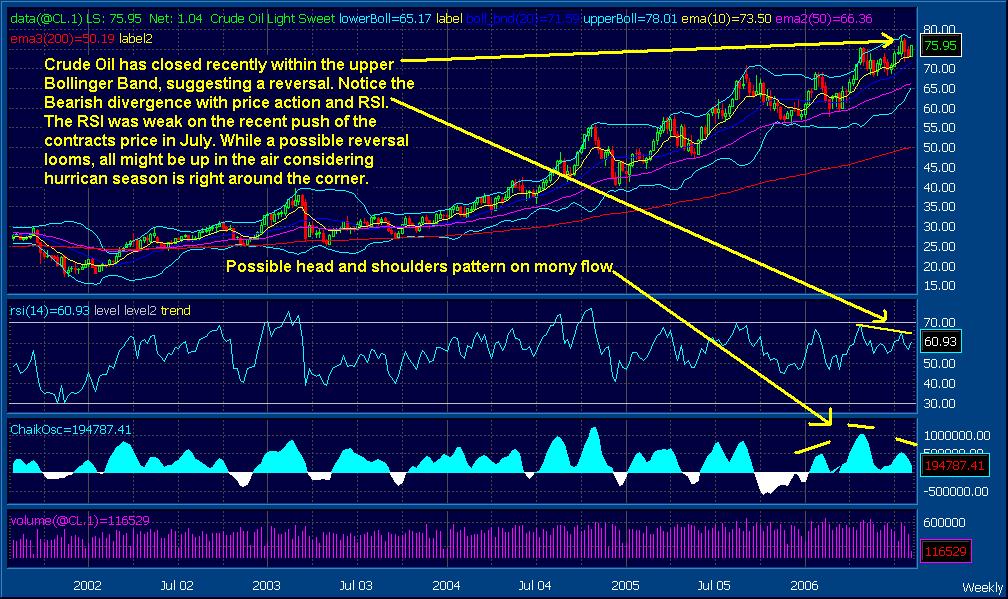
Is the recent rally for Light Sweet Crude about to come to an end? While chart above might present a well defined bull run, recent price activity might suggest the short term of oil might be due for a pullback. Upon further study, you will notice that in the weeks of July 15 and July 22, the price of the oil closed within the Bollinger Bands. Common interpretation of this pattern suggests that prices at this level might be pricey.
Digging deeper, we see that the RSI oscillator is suggesting a bearish divergence from the July highs. This suggests that the strength of the July move has been weak. This classic pattern suggests that prices might be due for a break, possible weakness in the near term.
Finally, the Chaikin Oscillator is suggesting that the July spike might be overdone and furthermore, the bull rally might need a pullback. This oscillator identifies the relationship of the average price of the underlying asset with respect to the volume present at that time. In other words, it shows how much money is being put to work in a particular asset at a given price. A high Chaikin Oscillator suggest money is flowing into the asset. In this case, we again see the bearish divergence of the Chaikin Oscillator and the price of oil. The Head and Shoulders pattern might suggest that a pause, or pullback might be imminent.
While these technical aspects are very revealing, there are some cautions to be aware of. We are at the critical juncture of hurricane Season. With expectations of a strong season, it would be prudent to see that these technical indicators can be disproved with a hurricane that can disrupt areas of the economy. Also, Middle East tensions always play a part with the oil situation. As Aug 22nd nears, the world is going to look on the Iranian nuclear issue. A negative tone on this situation could always effect oil. ¶ 10:48:00 AM
![[Most Recent Quotes from www.kitco.com]](http://kitconet.com/charts/metals/gold/t24_au_en_usoz_2.gif)
![[Most Recent Exchange Rate from www.kitco.com]](http://www.weblinks247.com/exrate/24hr-euro-small.gif)