Financial Market Analysis
By Shawn R. Carpenter
Wednesday, August 16, 2006
The Spiders....

The S&P 500 ETF is looking very nice!
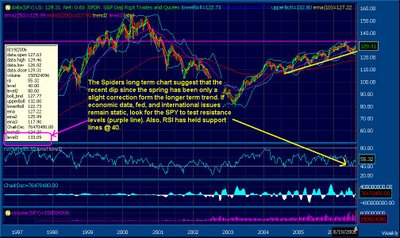
While the whole market has dipped since last spring due to numerous factors, the current state of the Spider ETF is looking well. In the chart above, you will see the 10 year weekly chart of the contract. You will notice the yellow support line of the multi-year rally that has taken place from 2003 to the present. This recent correction in the markets still lands within the support lines of the longer term rally. This correction also fell to the support level of 40 on the RSI, a bullish signal. While this may be true, we must take into account that in order for this rally to be sustained, it must break through the resistance level (purple line- 133.09). This resistance level is a key level in that the previous bull rally will end and a new bear rally will ensue if this level is not broken. Levels at 132.09, 132.80, 133.09, should also be watched with interest.
Given that there are multiple concerns which could still affect the overall market, we should be looking at this resistance level over the next few weeks. Concerns about hurricane season, nuclear issues with Iran and North Korea, as well as the Middle East War with Israel and Hezbollah will still play an active role should any one of these issue flare.
![[Most Recent Quotes from www.kitco.com]](http://kitconet.com/charts/metals/gold/t24_au_en_usoz_2.gif)
![[Most Recent Exchange Rate from www.kitco.com]](http://www.weblinks247.com/exrate/24hr-euro-small.gif)

