Financial Market Analysis
By Shawn R. Carpenter
Friday, May 26, 2006
Ford Motors...


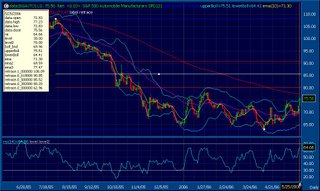
The Auto Sector should see some gains in the days and weeks ahead. Price movement based off of Fibonacci retracements lines of the downtrend suggest the retracements to be 80.20 (38.2%), followed by 85.52 (50%), 90.85 (61.8%), and 108.09 (100%).
Ford Motor company looks like it will be breaking its downtrend with recent price action suggesting that buyers are stepping up to the plate. In the chart above, we see that the yellow circles are points in which the price of Ford broke through the lower Bollinger Band, implying that the downtrend would continue. The green circle points out that the price closed above the lower Bollinger Band and has been confirmed by the May 23rd low. Also, the pinched Bollinger Bands suggest that a major price move is about to happen (either higher or lower). Given the pinched bands as well as confirmation on the low, I would expect Ford to start trading higher.
![[Most Recent Quotes from www.kitco.com]](http://kitconet.com/charts/metals/gold/t24_au_en_usoz_2.gif)
![[Most Recent Exchange Rate from www.kitco.com]](http://www.weblinks247.com/exrate/24hr-euro-small.gif)

