Financial Market Analysis
By Shawn R. Carpenter
Wednesday, May 03, 2006
The VIX points to market decline...
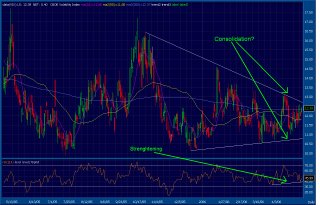
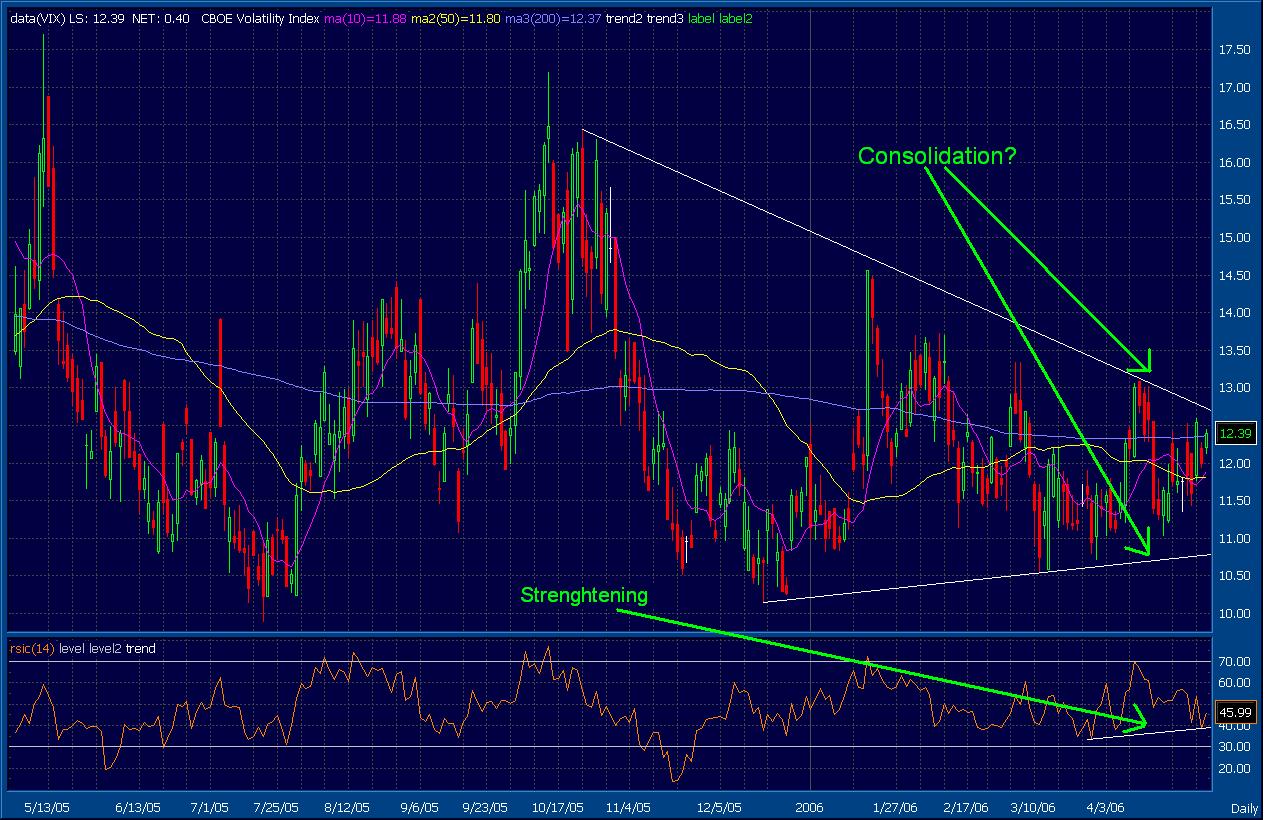
The VIX, a common index used to gauge how much volatility or risk there is in the market, seems to be implying an upward move. After downtrending since the multi-year long rally, there seems to be suggestions that the index is in a consolidation phase. The VIX is read as being on the opposite side of the market, such as a inverse reactor to the actual market. This means that as the VIX slides, investors are at ease with the current market conditions. As the market becomes weak or retraces, the VIX moves higher. At this point in time, we can say that the market is gearing up for a reversal.
In the above chart, we can see the wedge pattern that is forming on the VIX. Volatility in the total markets put vs call ratio suggests that investors are feeling worried. Maybe the Iran situation, price of gas at the pump, or an end to the multi-year rally is causing smart money to place bets against a move higher. ¶ 2:17:00 PM
![[Most Recent Quotes from www.kitco.com]](http://kitconet.com/charts/metals/gold/t24_au_en_usoz_2.gif)
![[Most Recent Exchange Rate from www.kitco.com]](http://www.weblinks247.com/exrate/24hr-euro-small.gif)