Financial Market Analysis
By Shawn R. Carpenter
Tuesday, May 30, 2006
Utilities?

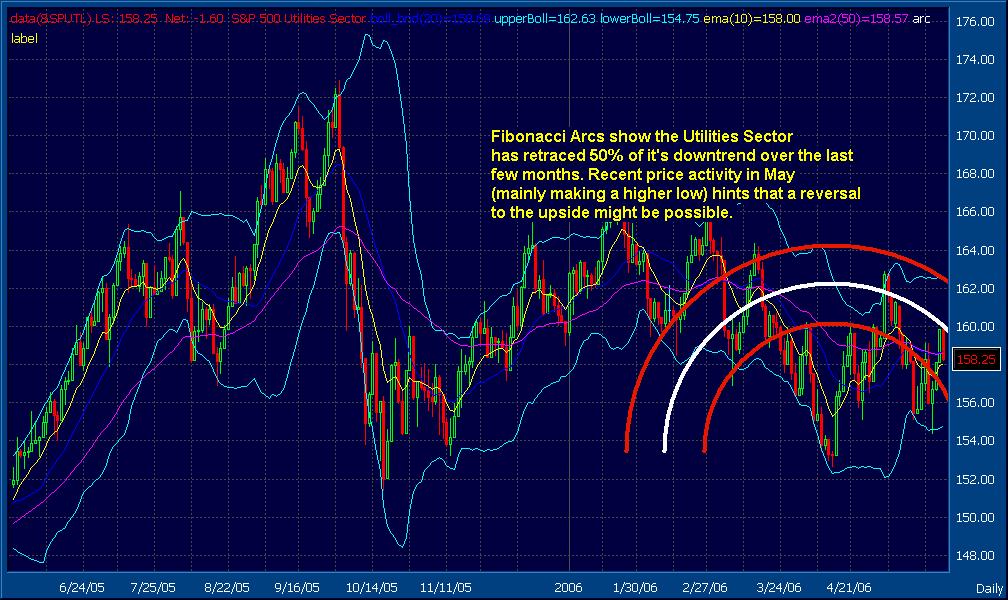
The S&P 500 Utilities Sector might break its current downtrend and head higher. The Fibonacci Arcs in the chart above show that it has recently retraced 50% of its downtrend in recent trading. While this is important, the higher low price pattern in the month of May is of more interest. It suggests that the trading pattern is moving away from a downtrend and might move higher. As the markets make monthly lows, a continuing international spectacle with Iran develops, consumer spending on the decline due to high gas prices, as well as heading into a summer season with increased hurricanes and storms; smart money might be moving some cash into this sector to be put to work. ¶ 5:53:00 PM

The S&P 500 Utilities Sector might break its current downtrend and head higher. The Fibonacci Arcs in the chart above show that it has recently retraced 50% of its downtrend in recent trading. While this is important, the higher low price pattern in the month of May is of more interest. It suggests that the trading pattern is moving away from a downtrend and might move higher. As the markets make monthly lows, a continuing international spectacle with Iran develops, consumer spending on the decline due to high gas prices, as well as heading into a summer season with increased hurricanes and storms; smart money might be moving some cash into this sector to be put to work. ¶ 5:53:00 PM
![[Most Recent Quotes from www.kitco.com]](http://kitconet.com/charts/metals/gold/t24_au_en_usoz_2.gif)
![[Most Recent Exchange Rate from www.kitco.com]](http://www.weblinks247.com/exrate/24hr-euro-small.gif)